
The JX Parabolic Regression Stop and Reverse Indicator is a popular and free indicator for the Forex market. It is useful for traders who want to identify potential reversal points in the market. The indicator is based on the Parabolic SAR (Stop and Reverse) indicator and is available for MT4 trading platforms. The JX Parabolic Regression Stop and Reverse Indicator uses a combination of trend lines and parabolic SAR to identify potential reversal points. It plots a series of dots on the chart that are used to calculate the stop and reverse points. The dots will move in the direction of the trend and will reverse when the market reverses. This helps traders identify potential turning points in the market and take advantage of them. The indicator is easy to use and provides traders with a visual representation of potential reversal points. It helps traders identify when to enter and exit trades and can be used to set stop loss and take profit levels. It is also useful for setting trailing stops and for determining when to close a position. The JX Parabolic Regression Stop and Reverse Indicator is an invaluable tool for traders who want to identify potential reversal points in the market. It is free and easy to use and can be used to improve trading performance.
MT4


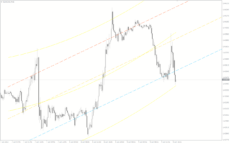
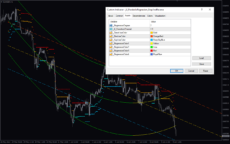
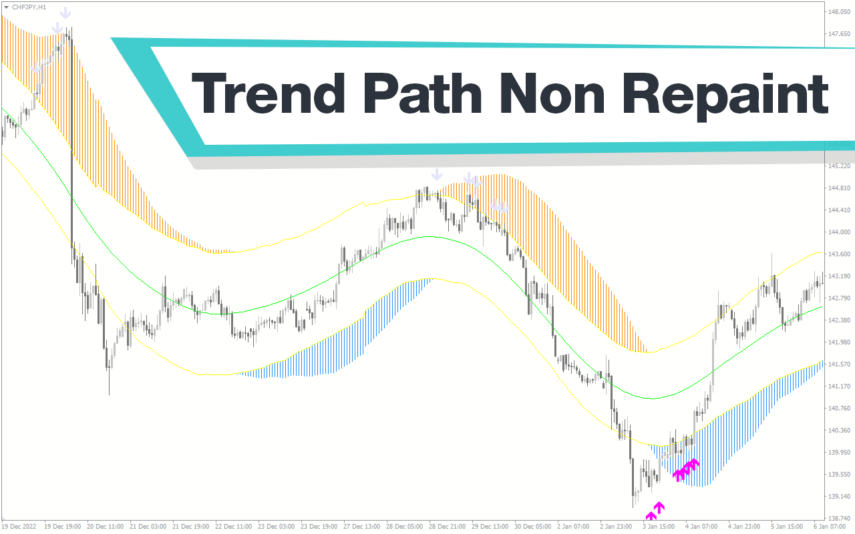
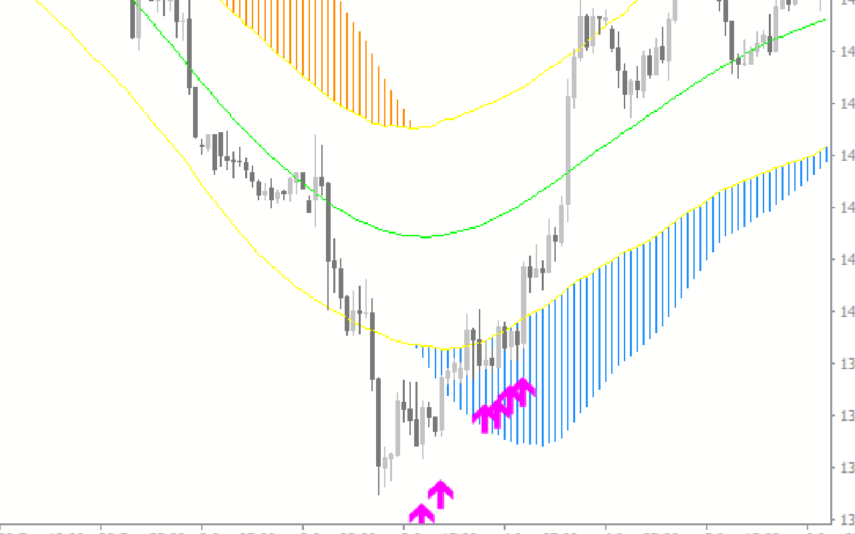
JX Parabolic Regression Stop And Reverse
The JX Parabolic Regression Stop and Reverse Indicator is a popular and free Forex indicator for MT4. The indicator works by plotting a parabolic regression line on the chart. This line is used to identify areas of support and resistance, which can be used to identify potential entry and exit points. The indicator also provides visual cues to help traders identify when a trend is about to reverse. This indicator is easy to use and can be a great addition to any Forex trader’s toolki
| Trading Style | , |
|---|---|
| Indicator Type | |
| Timeframe | , |
| Platform |
0
People watching this product now!
Downloads - 39
Description
Reviews (0)
How to Install
Related products
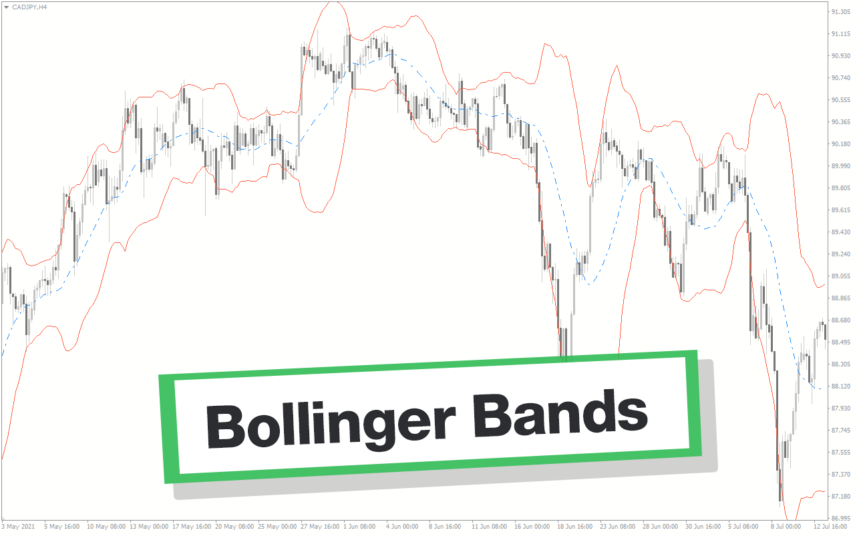
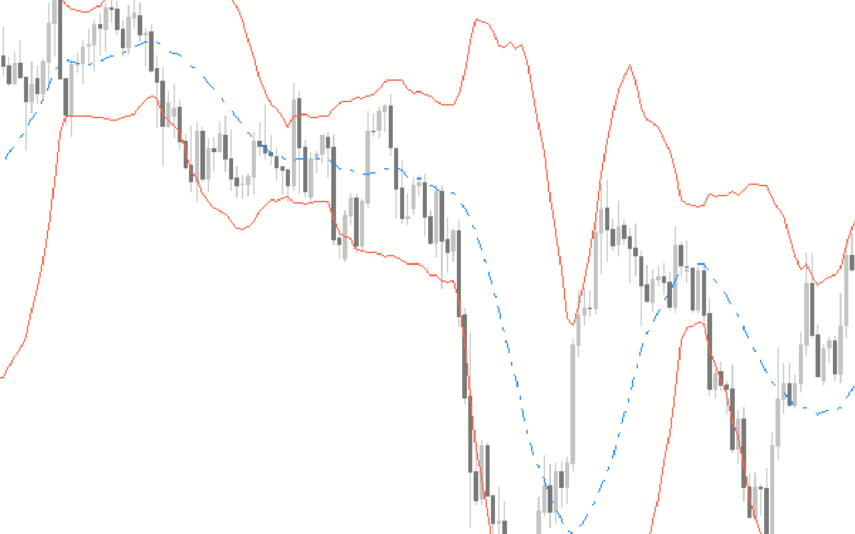
Bollinger Bands
The Bollinger Bands Indicator is a popular and useful Forex indicator for MT4 traders. It is a free indicator that helps traders to identify potential market entry and exit points. This indicator uses a combination of three moving averages to create upper and lower bands that can be used to identify price movements and trends. The bands are adjusted according to the market volatility and can be used to identify overbought and oversold conditions. The indicator is easy to use, and traders can customize the settings to suit their trading style. This indicator is a great tool for any trader looking to gain an edge in the Forex market.
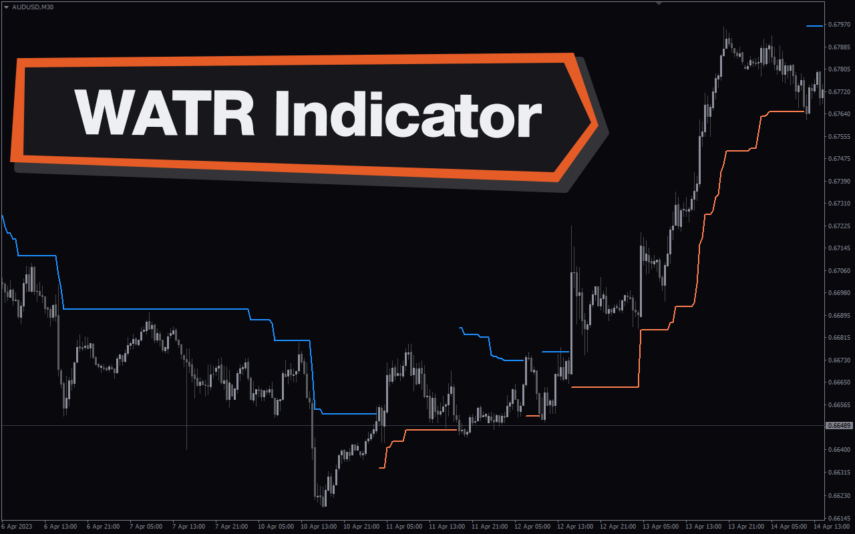
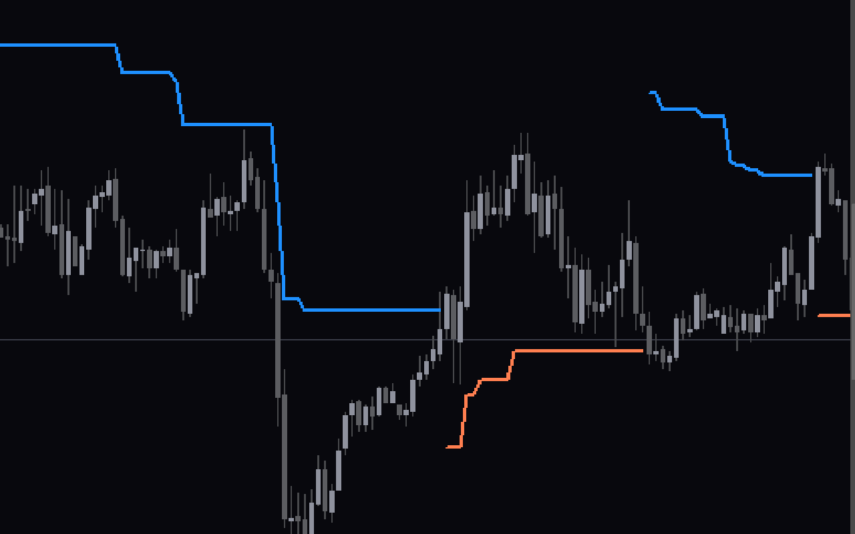
WATR Indicator
The WATR forex indicator is a popular and free MT4 indicator used by many traders. It can be used to identify trends, support and resistance levels, and other market conditions. It also offers a variety of features such as customizable alert settings, trend lines, and a wide range of indicators. It is also useful for scalping and day trading. The indicator is free to use and is popular among traders due to its accuracy and reliability.
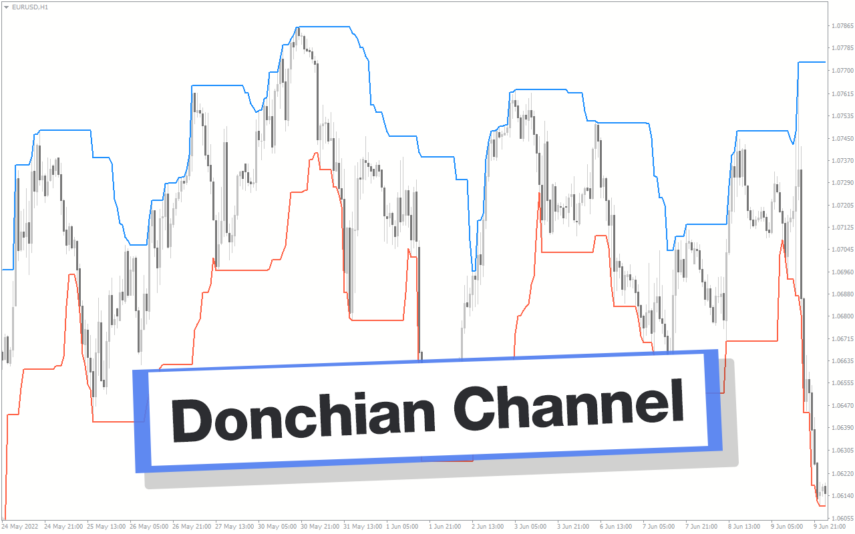
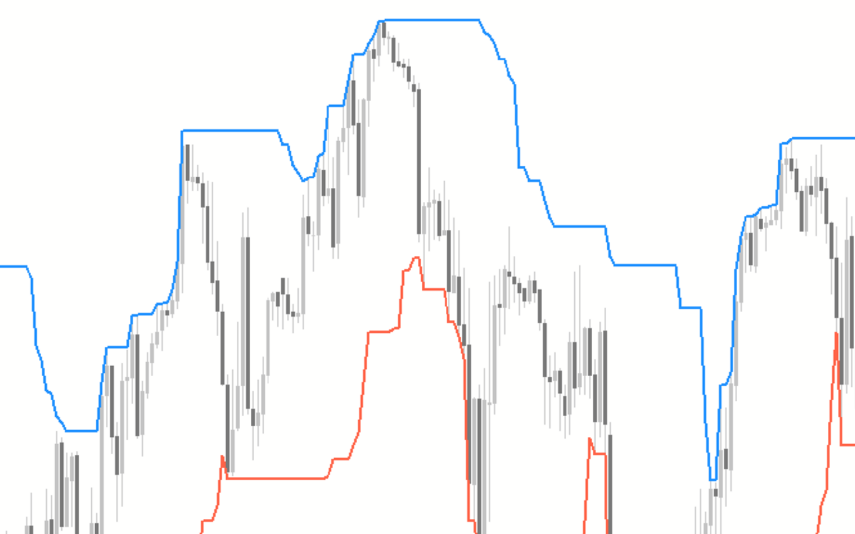
Donchian Channel
The Donchian Channel Indicator is a popular forex indicator that is widely used by forex traders to determine trend direction as well as entry and exit points designed to be used in the forex market with the MT4 platform. This indicator is very popular among traders because of its simplicity and efficiency, it works by determining the high and low of the price for a certain period and plotting a channel based on these values. The Donchian Channel Indicator is a popular and effective forex indicator that gives clear market entry and exit signals, making it an essential tool in a successful forex trader's toolbox.
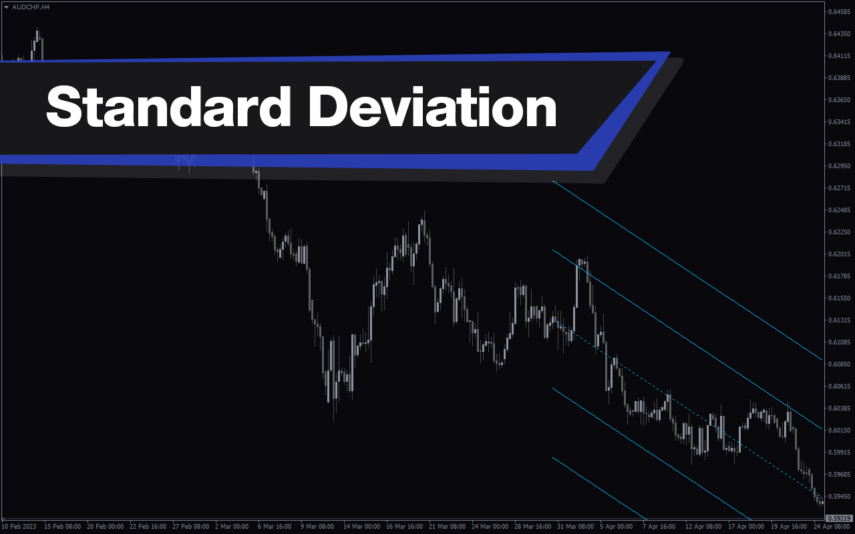
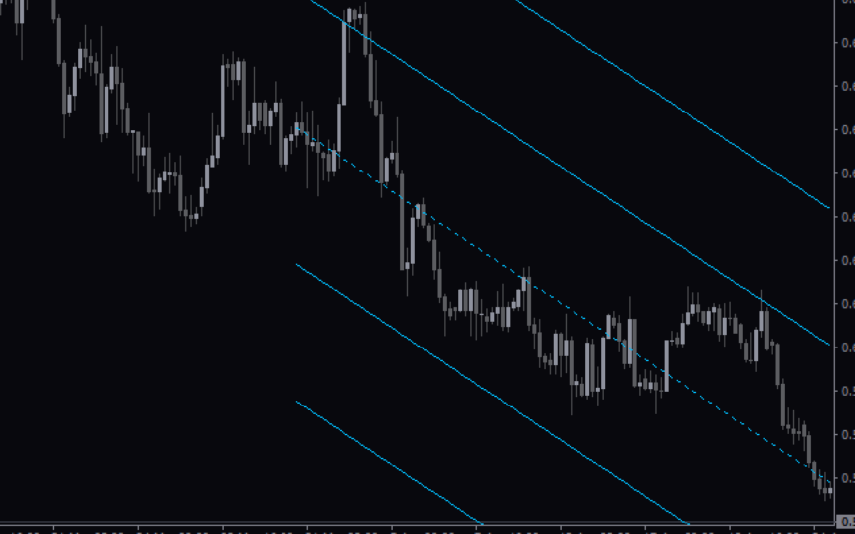
Standard Deviation Channel
The Standard Deviation Channel Indicator is a powerful and useful tool for Forex traders. It is a popular indicator for MT4 that is free to use and can be easily installed. The two lines represent the upper and lower bounds of the standard deviation, and they act as support and resistance levels. Traders can use these lines to identify potential entry and exit points when trading. This makes it an invaluable tool for traders who want to make informed and profitable trades.
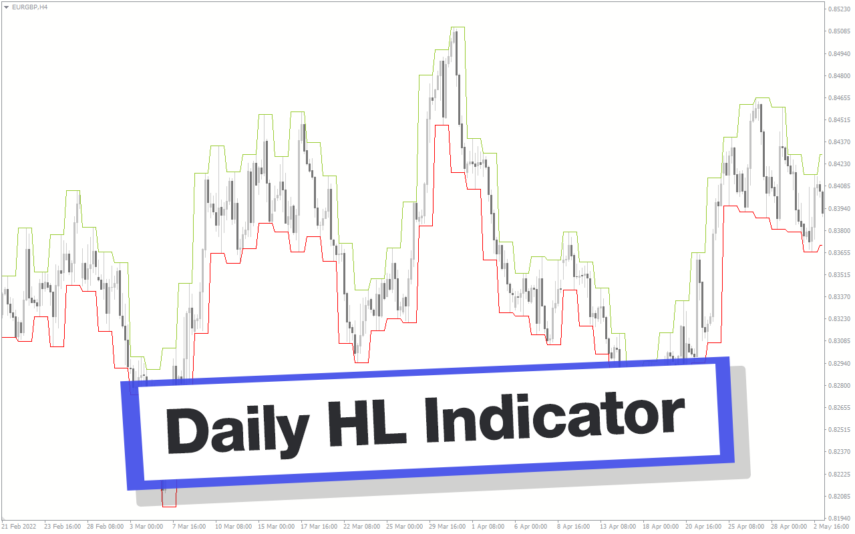
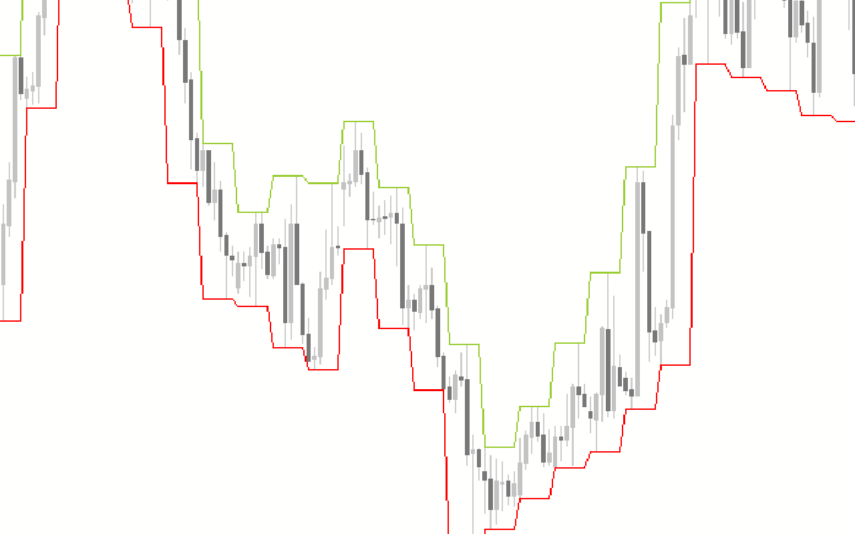
Daily HL
The Daily High Low Indicator is a popular and free Forex indicator for MT4 platform. This useful tool provides traders with a clear view of the daily high and low prices of the currency pair they are trading. The indicator is easy to install and use, and it can be used on any currency pair. It is also highly customizable, allowing traders to adjust the display of the indicator to their own preferences. The indicator provides an accurate view of the daily high and low prices, allowing traders to determine the best entry and exit points for their trades.
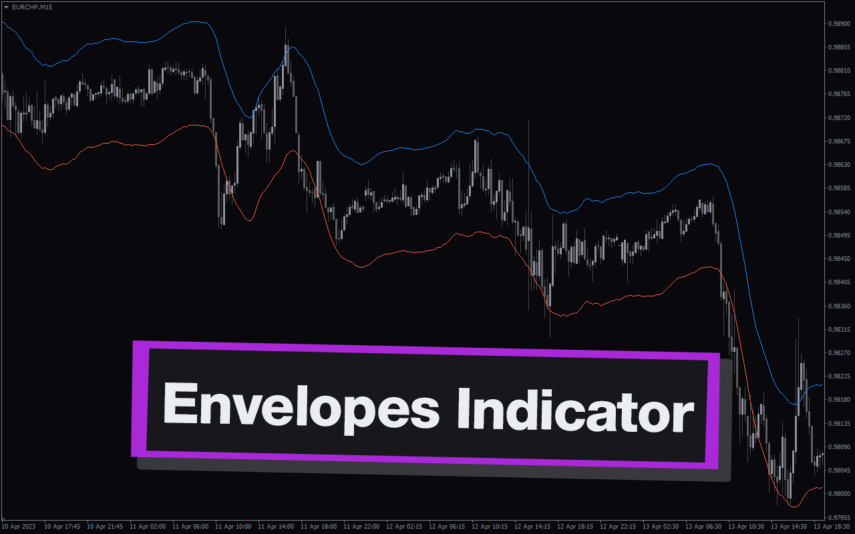
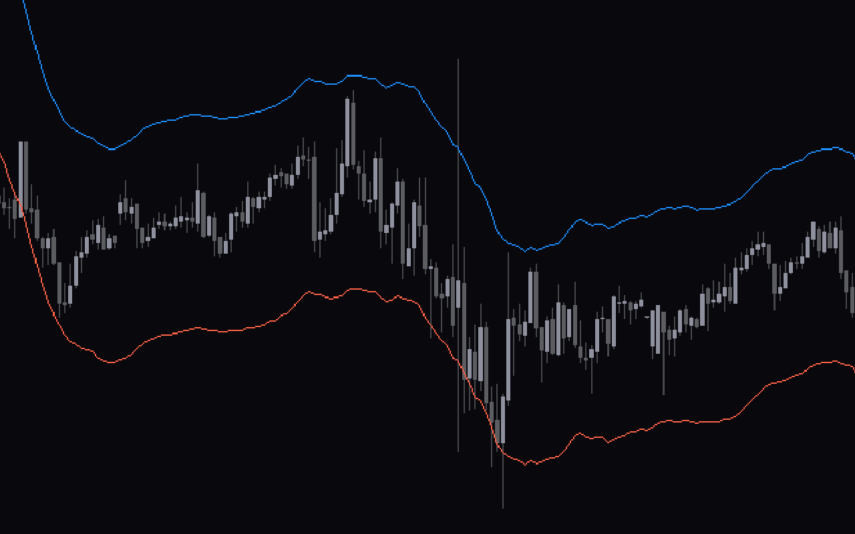
Envelopes Indicator
The Envelopes Indicator is a popular and useful tool for Forex traders. It is free to use and available for MT4 platforms. The indicator helps traders identify potential buy and sell signals in the market by plotting two bands around the price action. The bands are calculated by taking a moving average of the price and then adding and subtracting a percentage of that average. The Envelopes Indicator is a great tool for Forex traders looking for an easy way to identify potential trading opportunities.
Reviews
There are no reviews yet.