
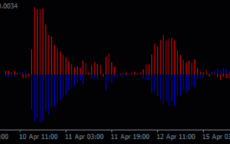
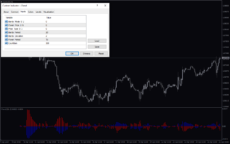
The i-Trend Histogram is a popular and useful forex indicator designed for the MT4 platform. It provides traders with valuable insights into market trends by displaying the strength of the current trend in histogram form. This indicator is free to use and easy to understand, making it a favorite among forex traders of all levels. The i-Trend Histogram calculates the difference between two moving averages to determine the strength of the trend. A positive value indicates a bullish trend, while a negative value indicates a bearish trend. Traders can use the i-Trend Histogram to confirm trend direction, identify potential trend reversals, and make informed trading decisions. By incorporating this powerful indicator into your trading strategy, you can increase your chances of success in the forex market.
MT4


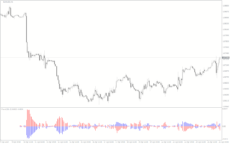
I Trend Histogram
I Trend Histogram Indicator for MT4 is a popular and useful forex indicator that is free to use. This indicator works by displaying the trends in the market through a histogram, making it easier for traders to make informed decisions. It can be used to identify trend changes and potential entry and exit points in the forex market.
| Indicator Type | , |
|---|---|
| Trading Style | , |
| Timeframe | , |
| Platform |
0
People watching this product now!
Downloads -
Description
Reviews (0)
How to Install
Related products
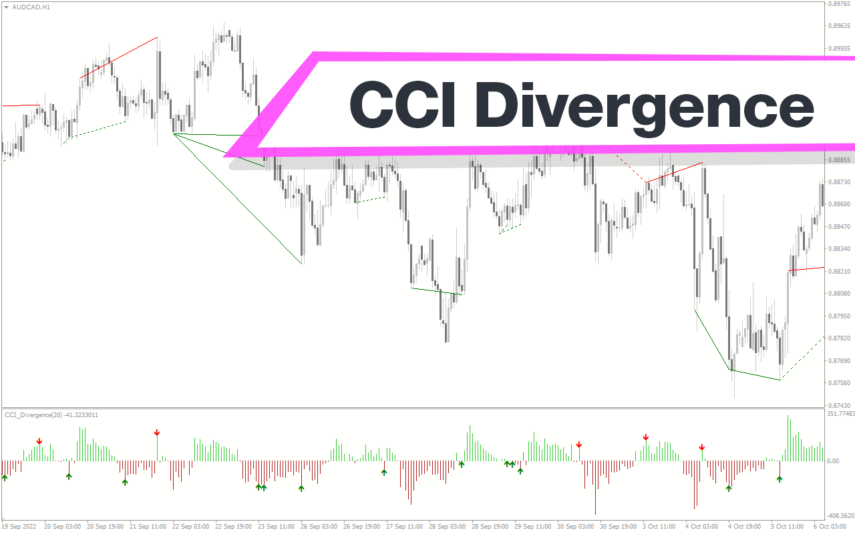
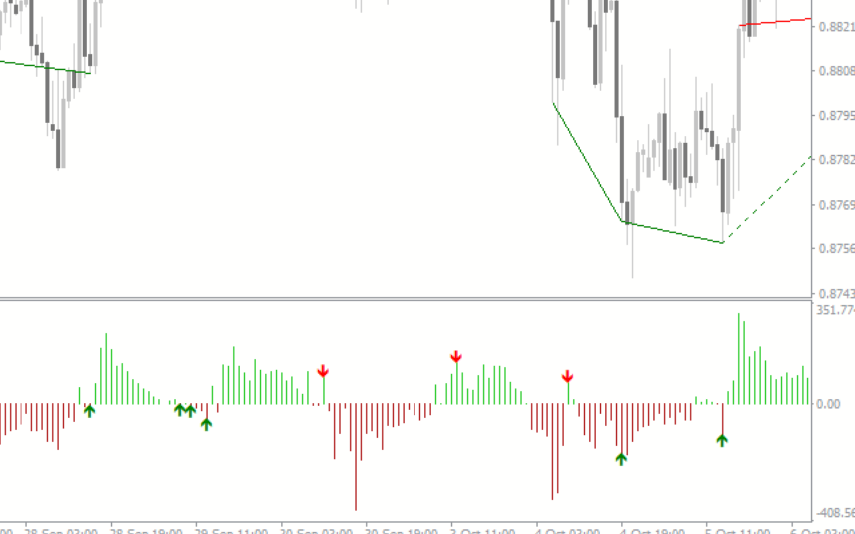
CCI Divergence
The CCI Divergence Indicator for MT4 is a useful and popular free Forex indicator. It is used to identify potential reversals in the market by looking for divergences between price and the Commodity Channel Index (CCI). The indicator uses the CCI to determine when the market is overbought or oversold and when the trend is likely to reverse. It will then plot a divergence line on the chart to indicate potential reversal points. The CCI Divergence Indicator for MT4 is a great tool for traders of all levels and can be used to help traders make more informed decisions.
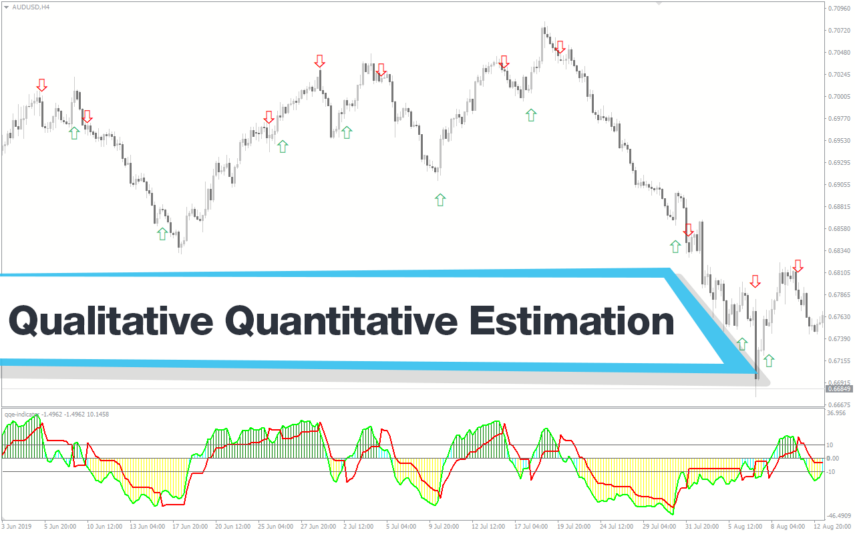
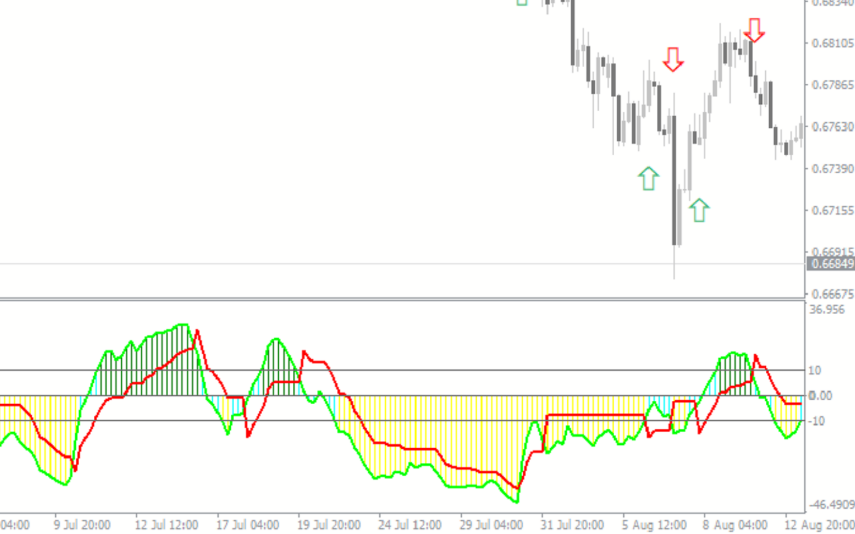
Qualitative Quantitative Estimation
The Qualitative Quantitative Estimation Indicator is a powerful tool for traders in the Forex market. It's a new and popular indicator that works with the MT4 platform. The QQE Indicator is used to determine market trends, identify overbought and oversold positions, and detect divergence in prices and momentum.
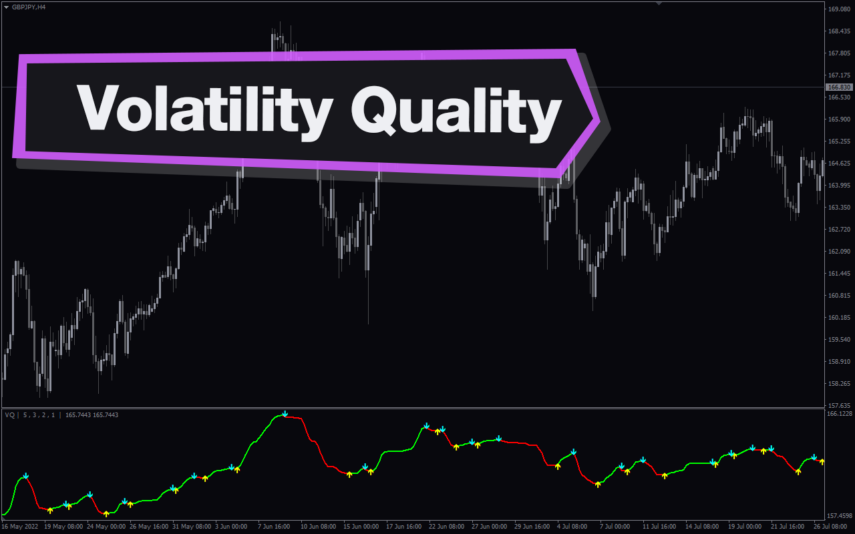
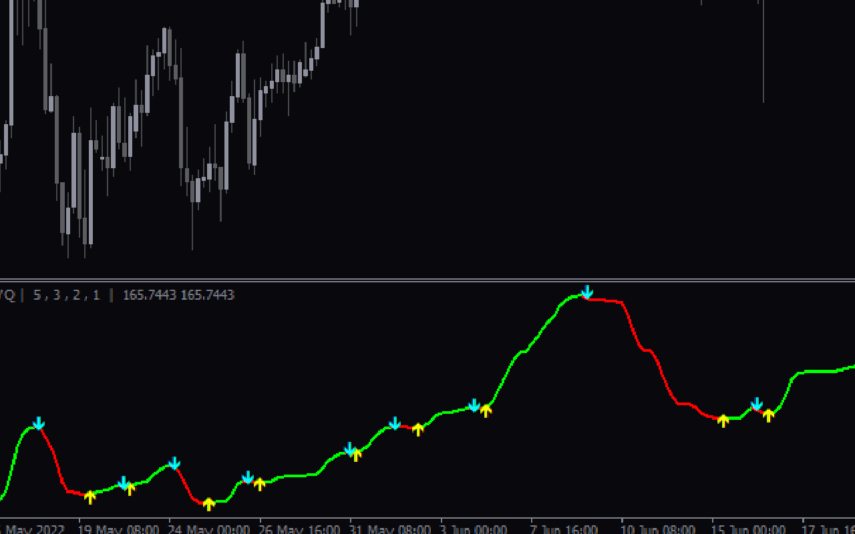
Volatility Quality
The Volatility Quality Indicator is a useful and popular free Forex indicator for MT4 that helps traders identify the best entry and exit points in the market. This indicator is based on the ratio of the price range of a given period to the average true range of the same period. It helps traders determine the quality of the volatility of a currency pair. It is also a great tool for identifying support and resistance levels. The Volatility Quality Indicator is a great way to make informed decisions when trading Forex.
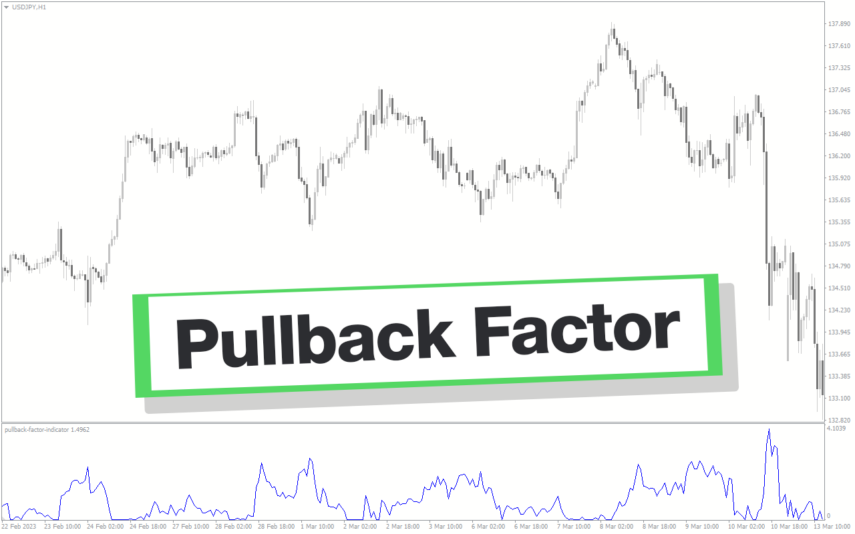
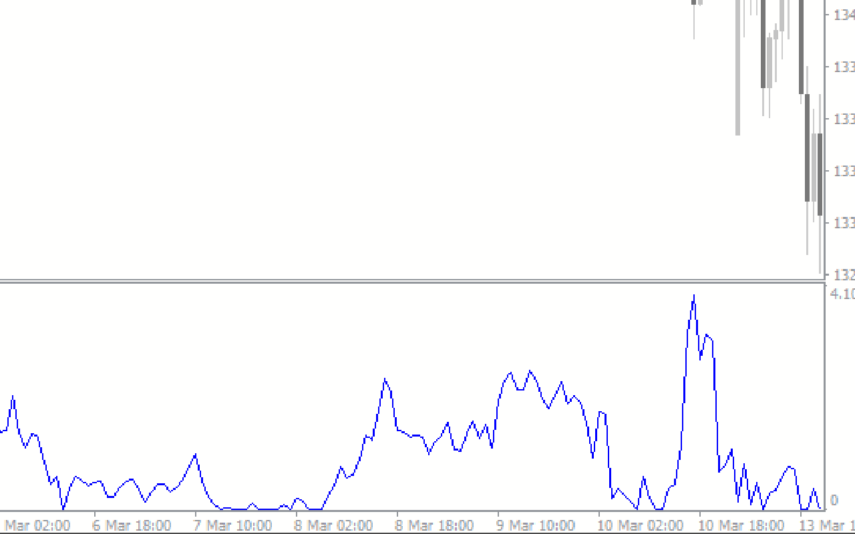
Pullback Factor
Pullback Factor Indicator is a popular and new trend-following indicator designed for use in the forex market. It helps you to identify the end of a trend retracement and the resumption of the trend. With its unique algorithm, the indicator predicts the extent of a trend pullback, enabling traders to enter the market with precision and accuracy.
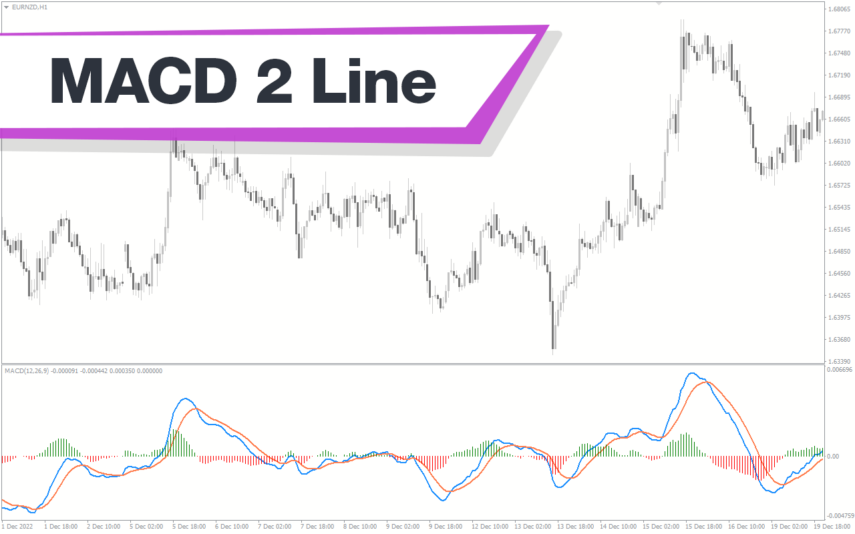
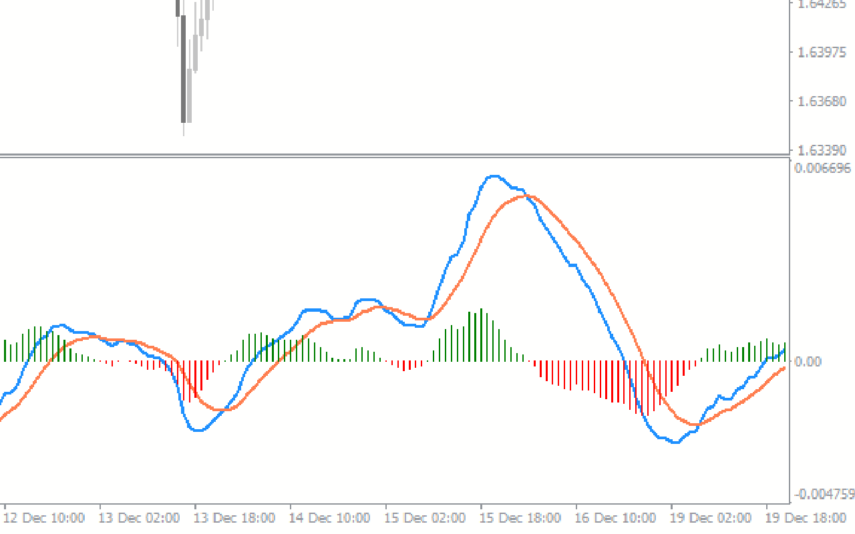
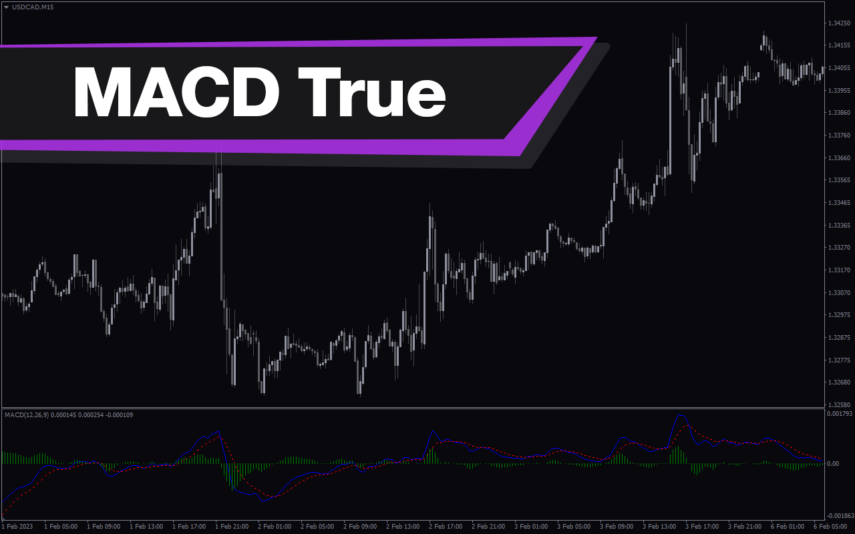
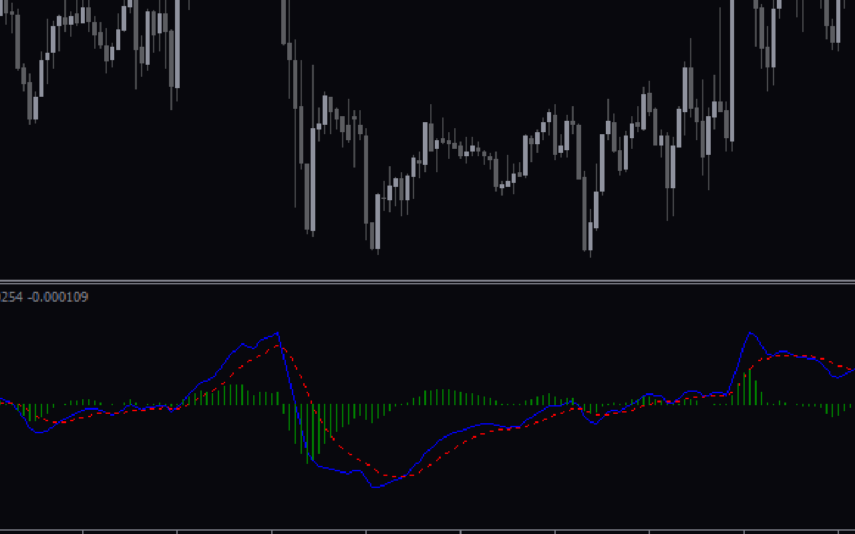
MACD True
The MACD True Indicator is a popular and useful MT4 forex indicator that helps traders identify trends and momentum in the market. It is a modified version of the traditional MACD indicator that incorporates a color-coded histogram to provide more visual cues for traders. This indicator works by measuring the difference between two moving averages, and it is often used in conjunction with other technical indicators to confirm trading signals. Traders of all levels can benefit from using the MACD True Indicator in their trading strategies.
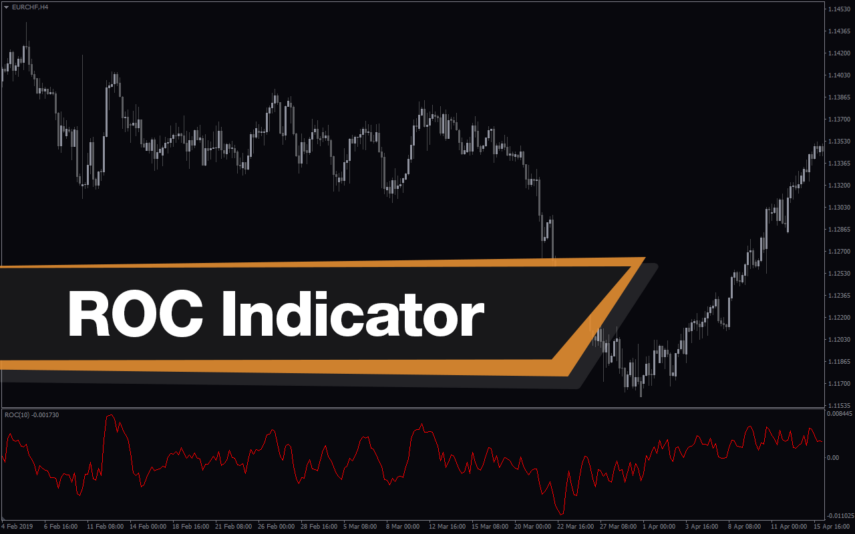
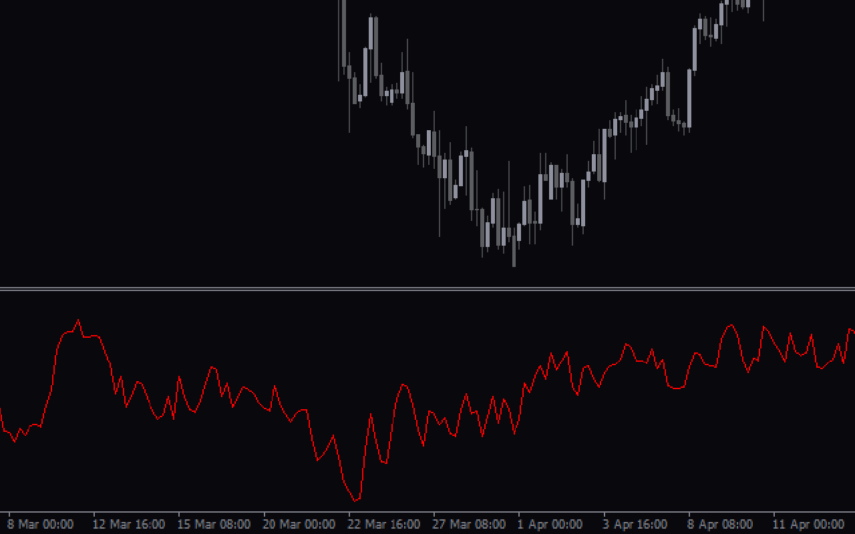
ROC Indicator
The ROC Indicator is a popular and useful Forex indicator for MT4 that is free to download. It is used to measure the rate of change in price movements over a given time period. The indicator is useful for traders as it can help identify when a price is overbought or oversold, and when a trend is reversing. The ROC Indicator is a popular and useful tool for traders who want to make informed decisions about their trading strategies.
Reviews
There are no reviews yet.