
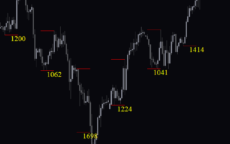
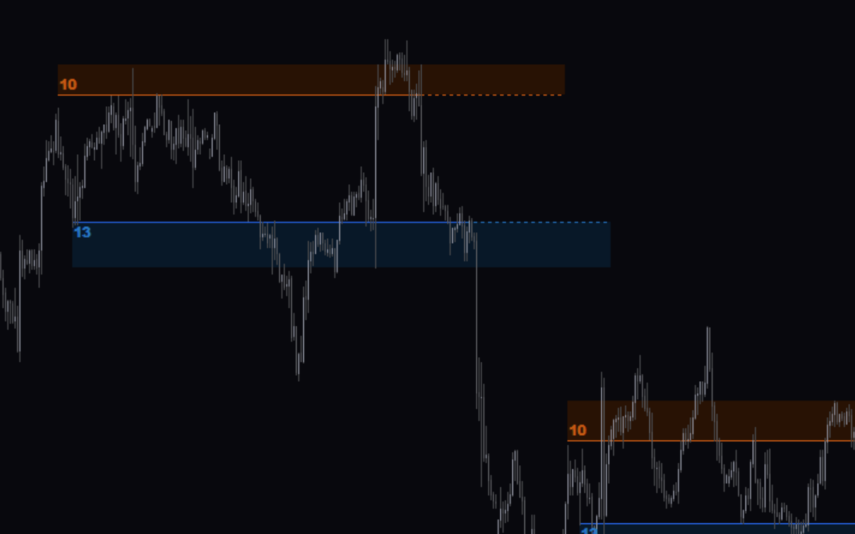
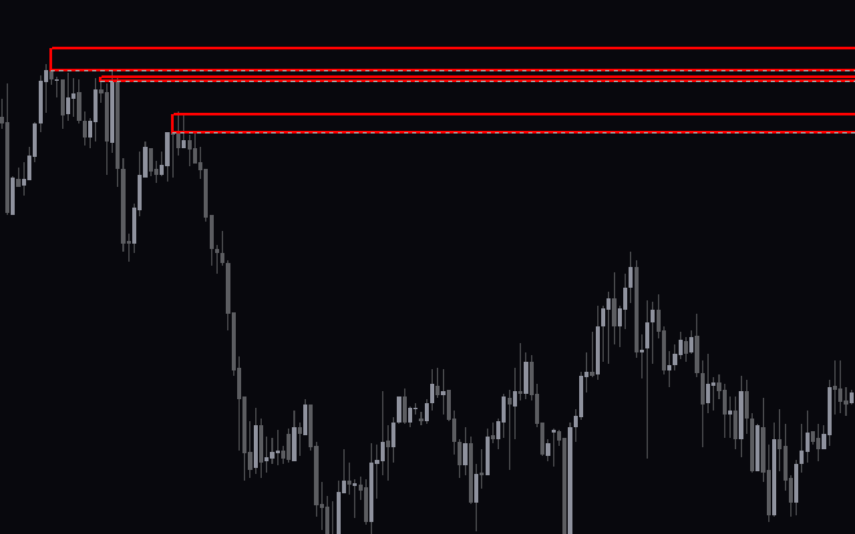
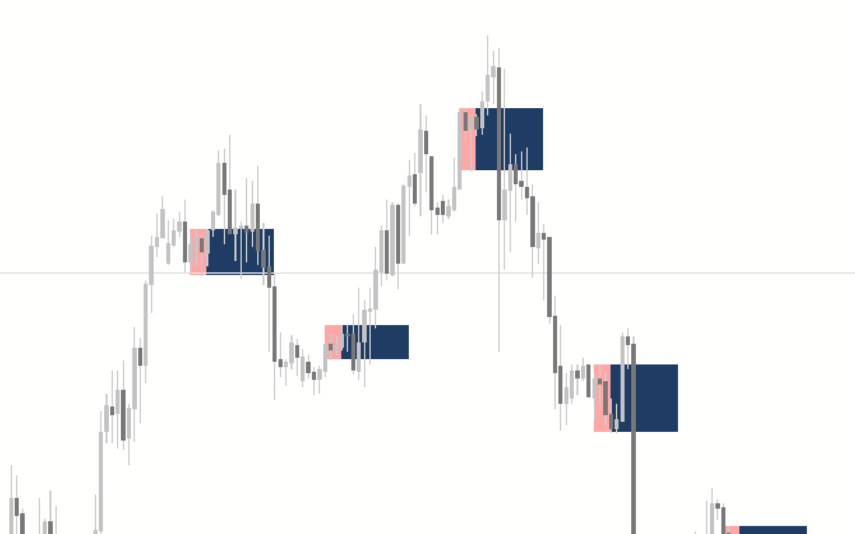
The High Low Channel Indicator is a popular and free Forex indicator for MT4 that is useful for both novice and expert traders. It is a technical analysis indicator that helps traders identify the current trend in the market. The indicator plots two lines on the chart, one representing the highest high over a period of time, and the other representing the lowest low. The High Low Channel Indicator works by calculating the highest and lowest prices of a given period. It then plots the two lines on the chart, one representing the highest high and the other representing the lowest low. The indicator also allows traders to customize the period for which the high and low levels are calculated. This makes it easy for traders to identify support and resistance levels. The High Low Channel Indicator is an easy to use tool that can be used to recognize support and resistance levels.
MT4


High Low Channel
The High Low Channel Indicator is a popular and free MT4 forex indicator that can be used to identify potential trading opportunities. The indicator plots two parallel lines, one above the current price and one below, creating a channel. When price breaks above or below the channel, it can be a signal of an impending trend reversal or breakout. The indicator also includes a histogram which can be used to identify potential support and resistance levels. The indicator is easy to use and can be a great addition to any trader’s arsenal.
| Trading Style | , |
|---|---|
| Indicator Type | |
| Timeframe | , , |
| Platform |
0
People watching this product now!
Downloads - 34
Description
Reviews (0)
How to Install
Related products
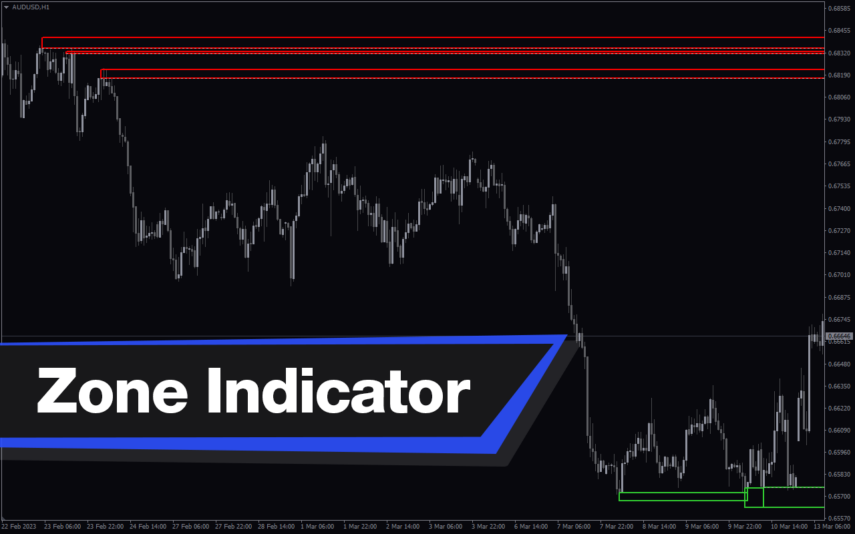
Zone Indicator
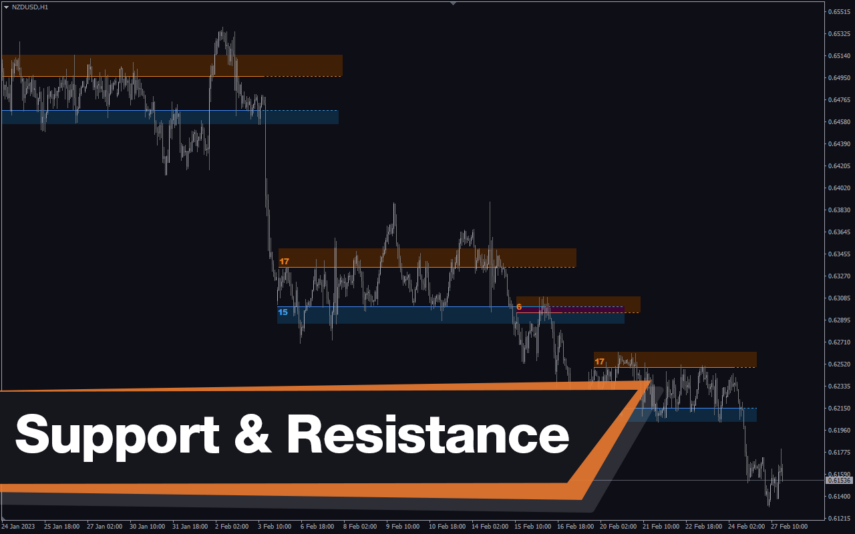
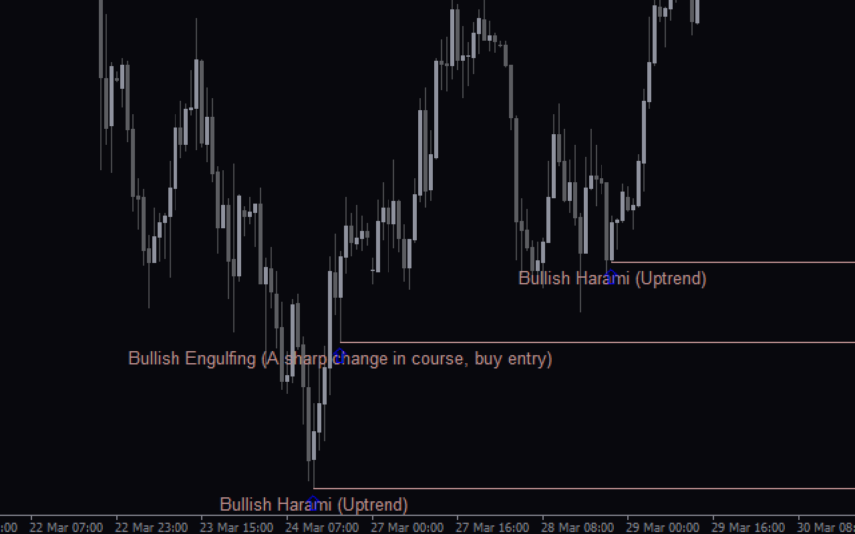
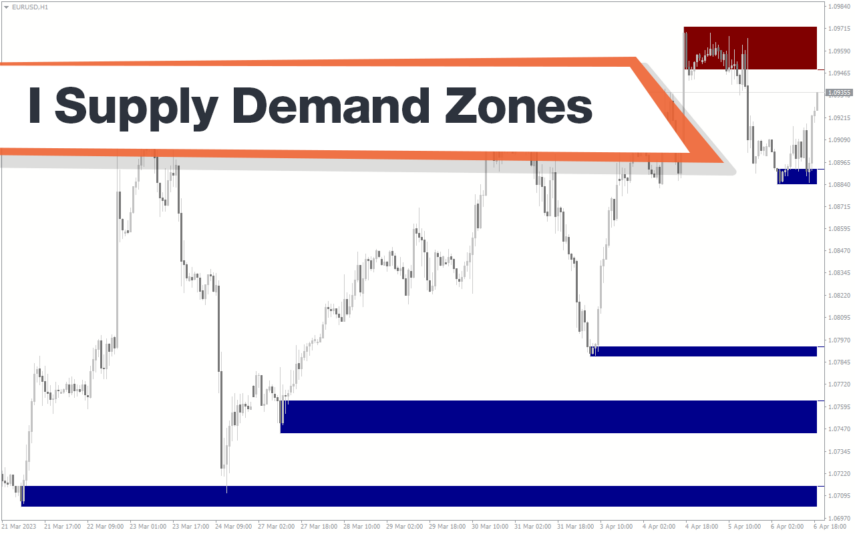
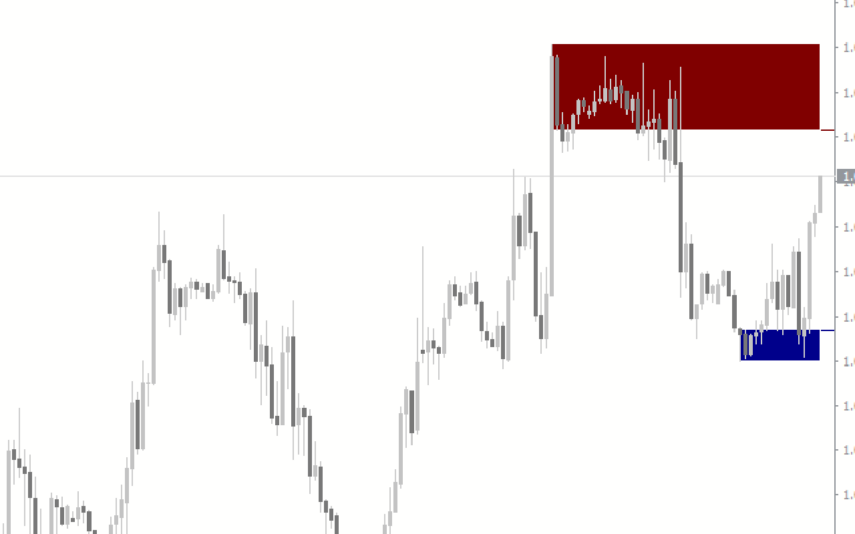
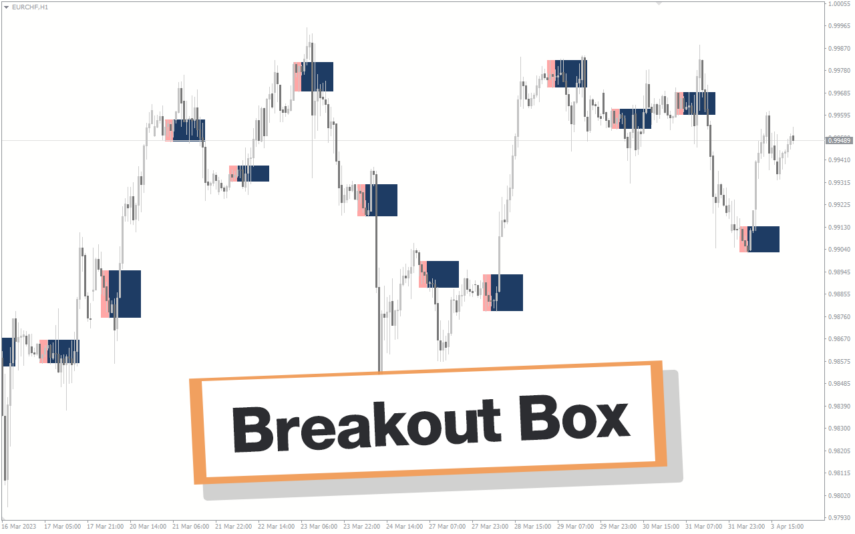
The Zone Indicator is a popular MT4 Forex trading tool that is new to the market and is available as a free download. This is essential for forex traders who rely on support and resistance strategies, trend traders and traders who want to anticipate price action. The Zone indicator automatically displays strong support or resistance levels on the chart.
Reviews
There are no reviews yet.