


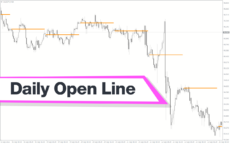
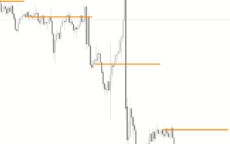
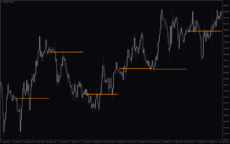
The Daily Open Line indicator for MT4 is a custom Forex trading indicator that plots horizontal lines at the beginning of a daily open price. In other words, the indicator marks the daily open price, a zone of interest in the financial market.
Daily open is often employed in intraday technical analysis to analyze and project the daily movement of financial instruments. Besides, daily open tends to act as a support and resistance zone for trend reversal or continuation. Therefore, the indicator provides a daily reference point for traders to easily identify daily price openings and make informed decisions.
Features of the Daily Open Line Indicator for MT4
The indicator is a chart-friendly tool that marks the daily price open with dotted lines. It is designed with time zone settings, which enables it to reflect the daily market open based on the time zone of a trader. Therefore, traders can adjust the indicator’s time zone under the setting parameters to ensure the daily open aligns with their local market time.
Benefits of Using the Indicator
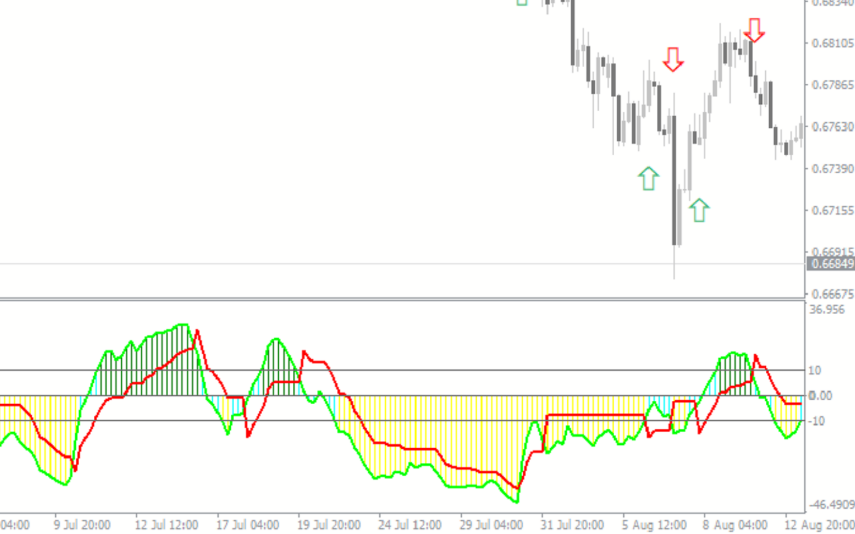
- Intraday Trend Analysis: The daily open can help traders anticipate the potential direction of the trend. For example, the daily trend is bullish if the price continually makes higher highs and lows above the daily open. Similarly, a continual lower high and lower low below the daily open may suggest a bearish trend.
- Enhances Decision Making: As noted above, the daily open is a potential psychological support and resistance level, which makes it a zone for different trading decisions. Thus, traders can use the indicator to find short-term trend reversal and breakout trading opportunities.
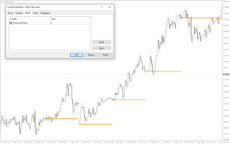
Indicator Settings Description
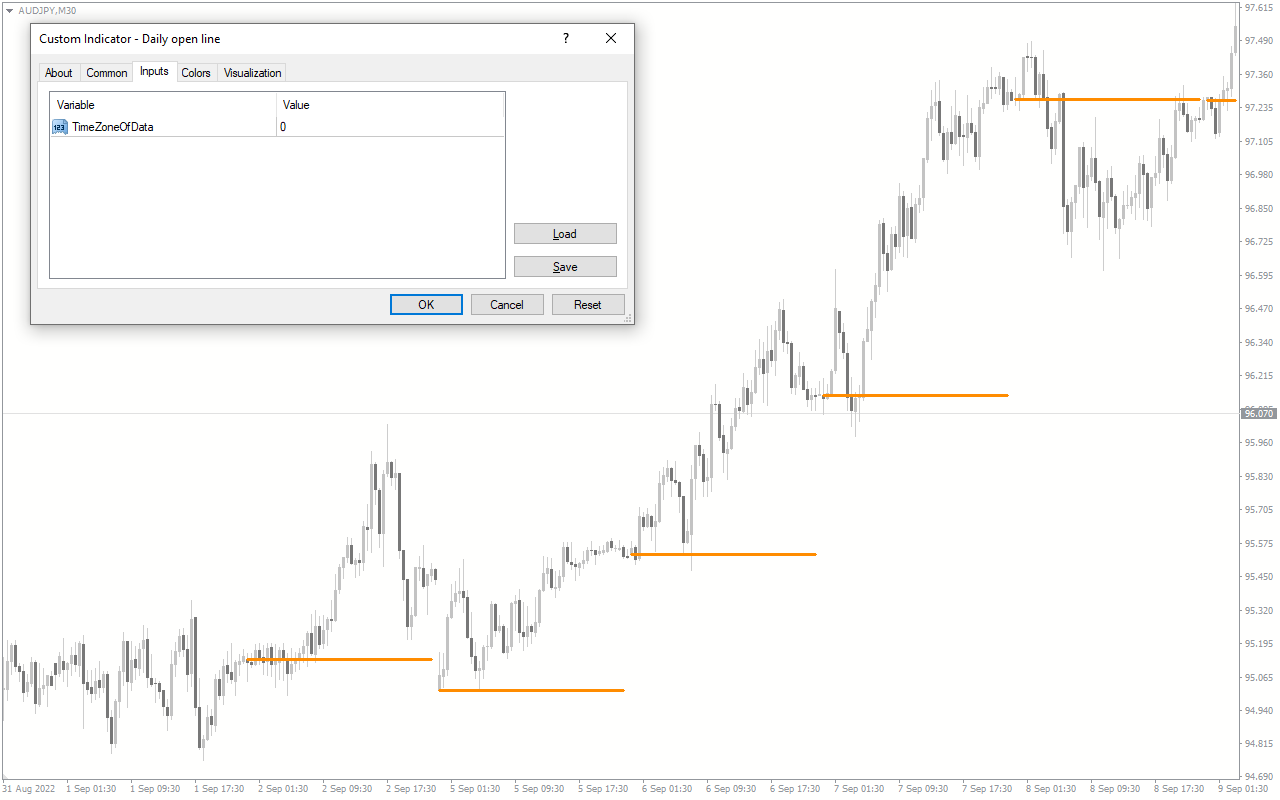
The indicator comes with the following customizable settings:
TimeZoneofData: This parameter is used to set the time zone.
Reviews
There are no reviews yet.