
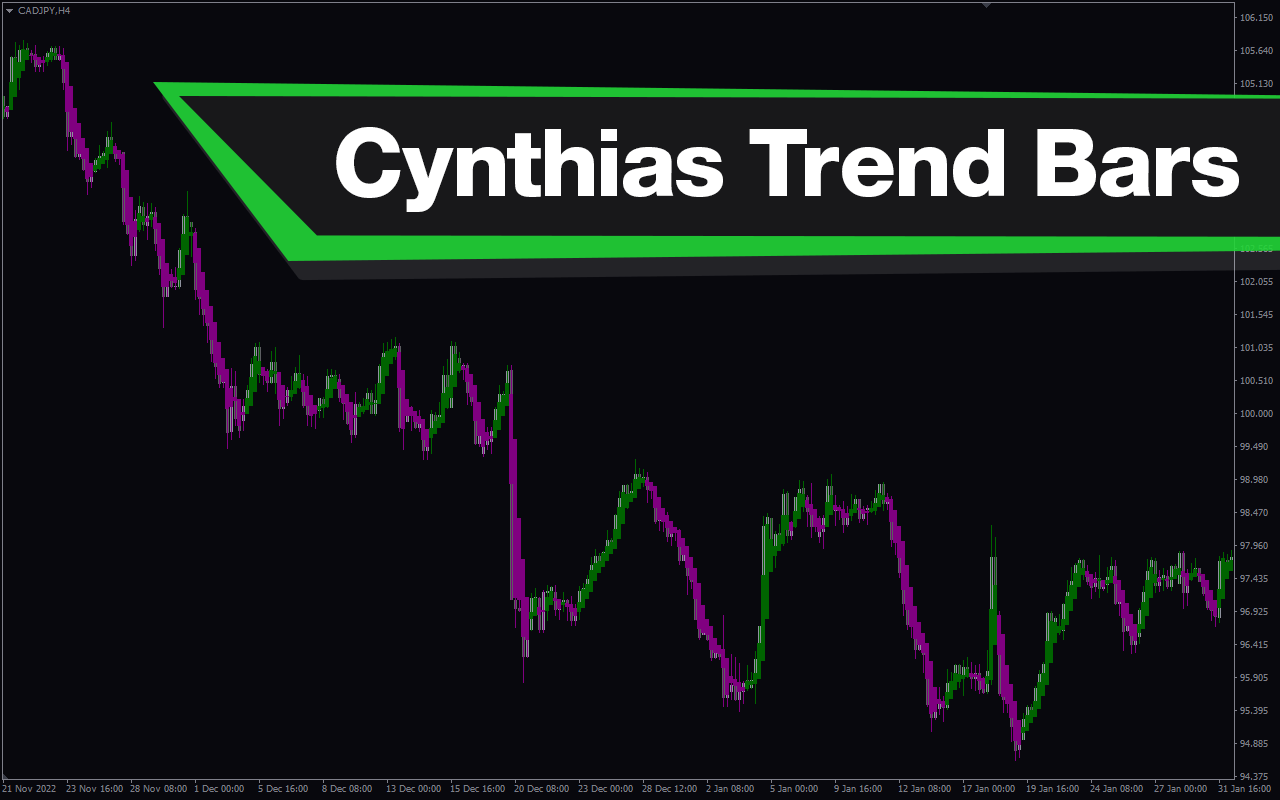
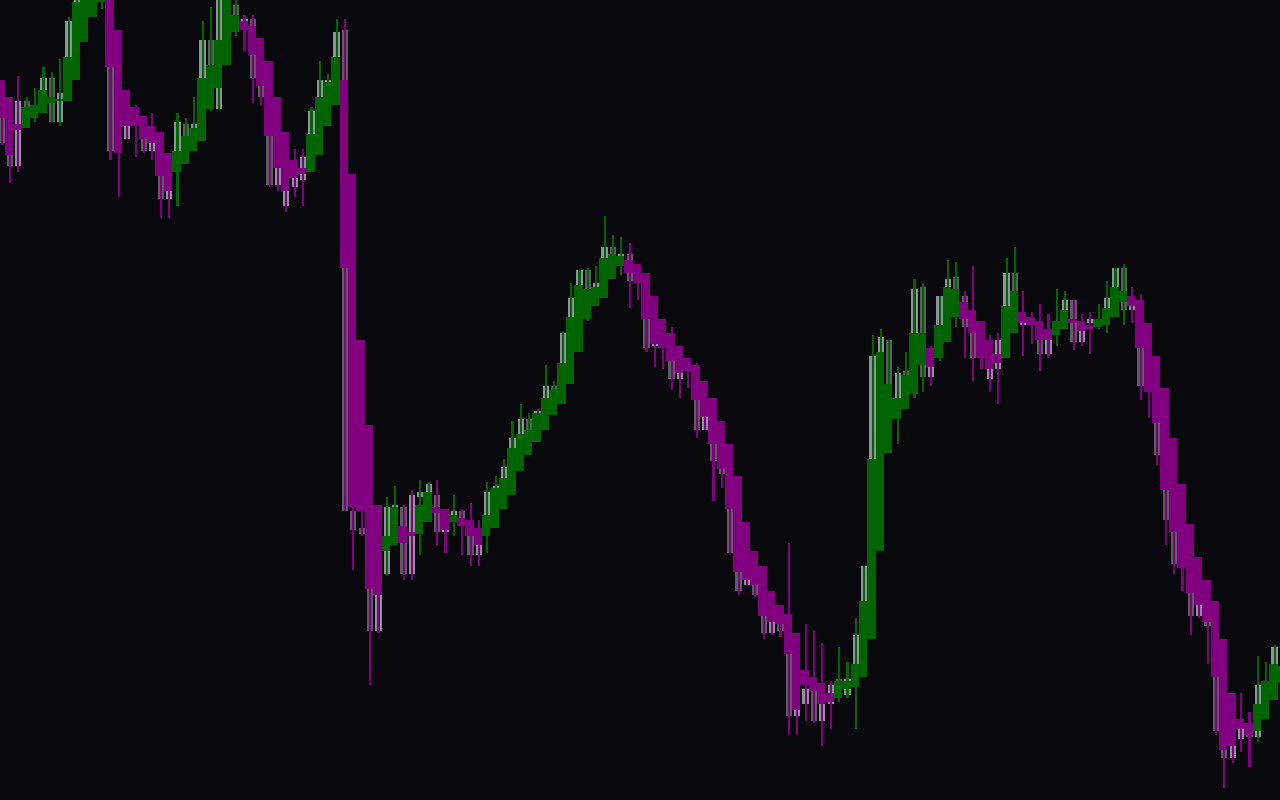
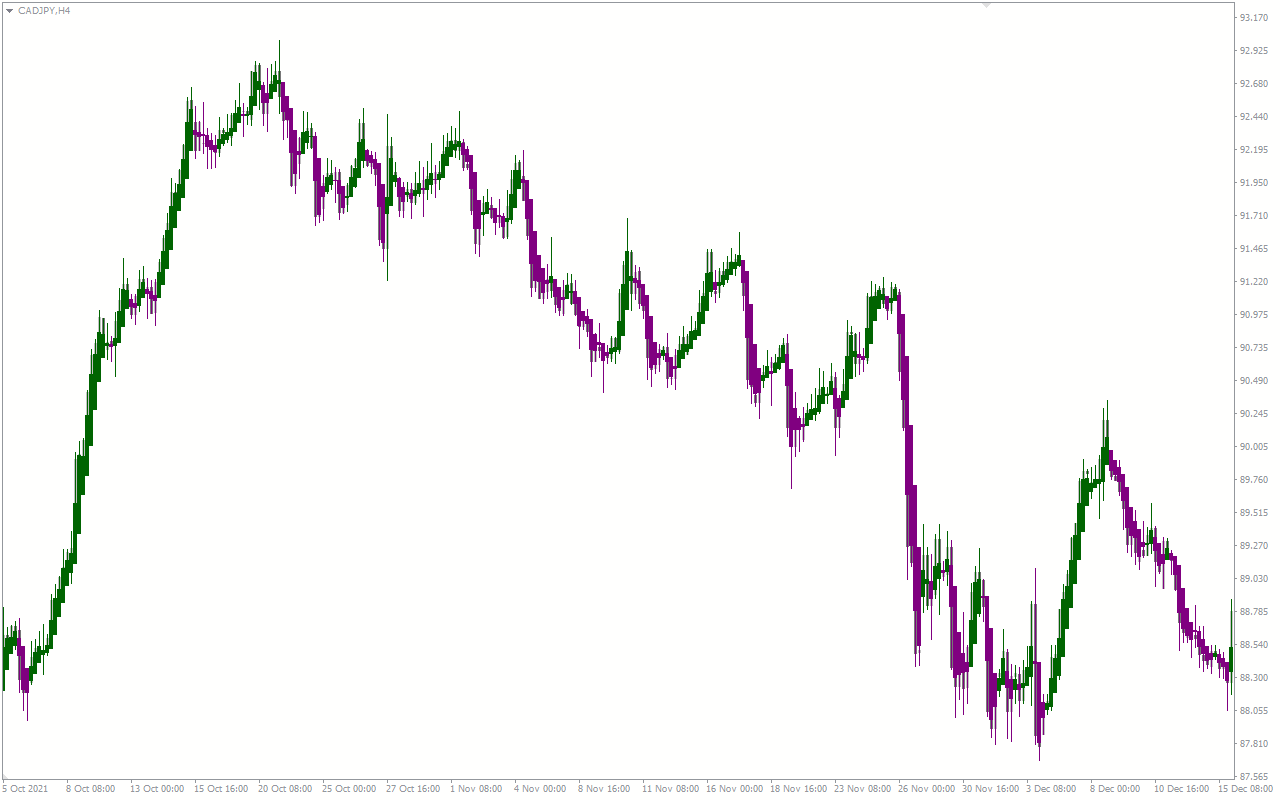
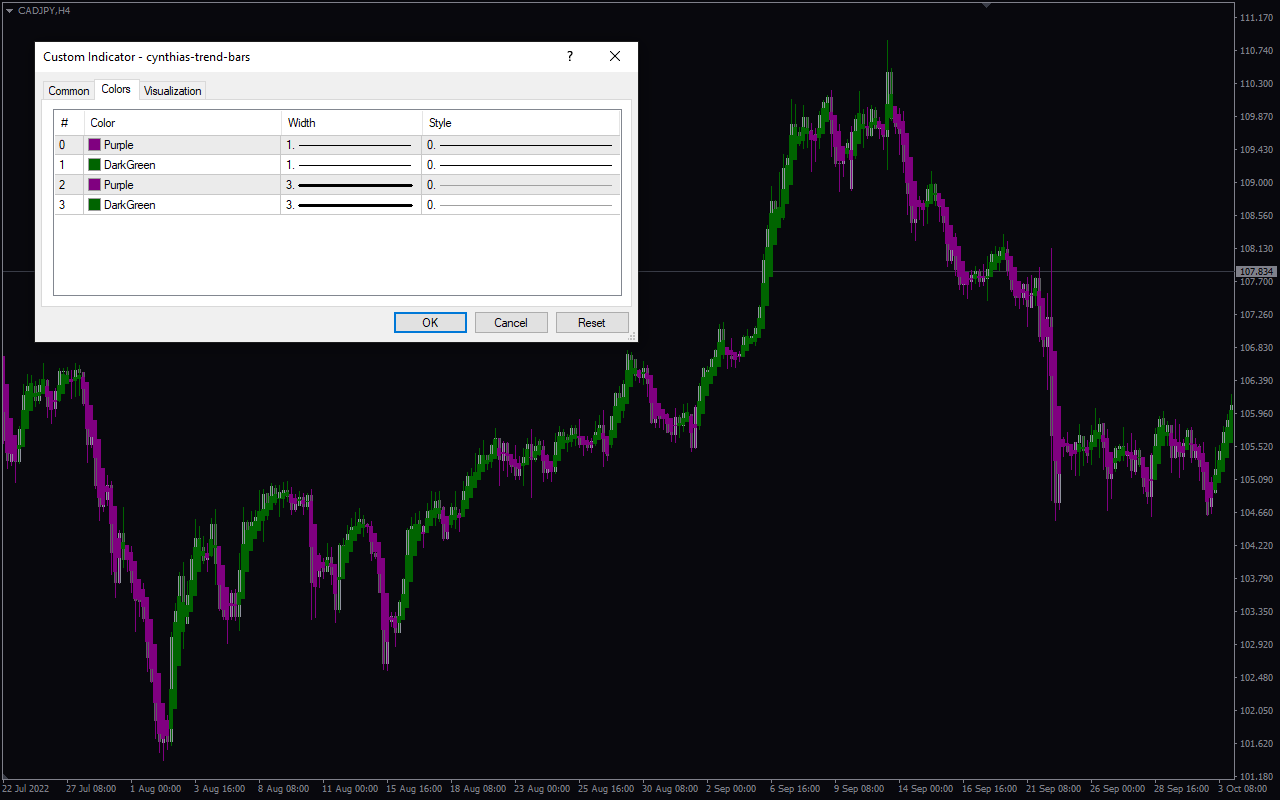
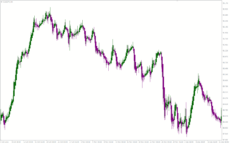
Cynthia’s Trend Bars Indicator is a useful and popular free Forex indicator for MT4. It is designed to help traders identify trend direction and strength, and also to determine potential trend reversals. The indicator uses a combination of three different indicators to accurately identify trend direction and strength. The first indicator is the Moving Average Convergence Divergence (MACD), which is used to measure momentum. The second indicator is the Relative Strength Index (RSI), which is used to identify overbought and oversold conditions. Finally, the indicator also uses a Parabolic SAR to identify potential trend reversals. When all three indicators are combined, traders can get a better understanding of the overall trend direction and strength. The indicator also provides visual cues such as arrows and colored bars to help traders identify potential trend reversals. Additionally, the indicator can be used to determine entry and exit points in the market. This indicator is free to download and use on the popular MT4 platform.

MT4
Cynthias Trend Bars
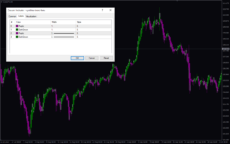
Cynthia’s Trend Bars Indicator is a useful and popular free MT4 Forex indicator. It is designed to help traders identify and follow trends, by displaying colored bars on the charts. It is a great tool for traders of all levels, from beginner to expert.
| Platform | |
|---|---|
| Indicator Type | |
| Trading Style | |
| Timeframe |
0
People watching this product now!
Downloads - 23
Description
Reviews (0)
How to Install
Related products
Cypher Pattern
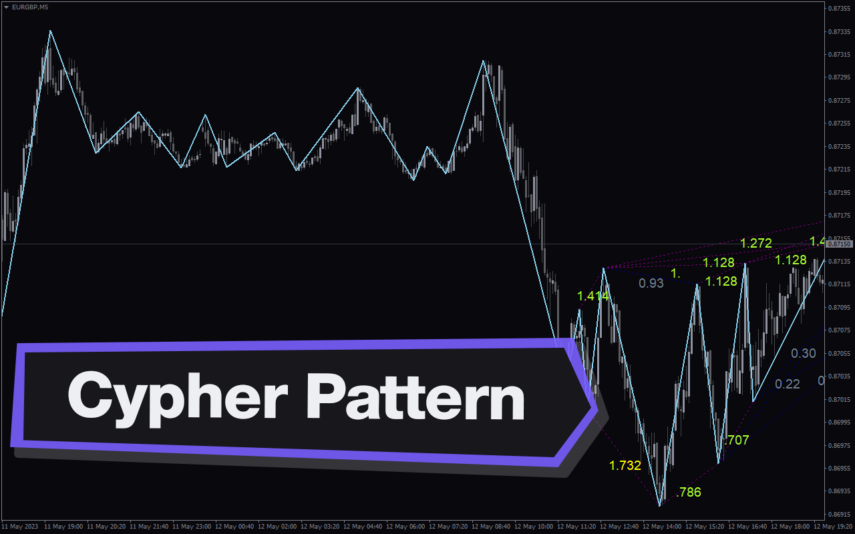
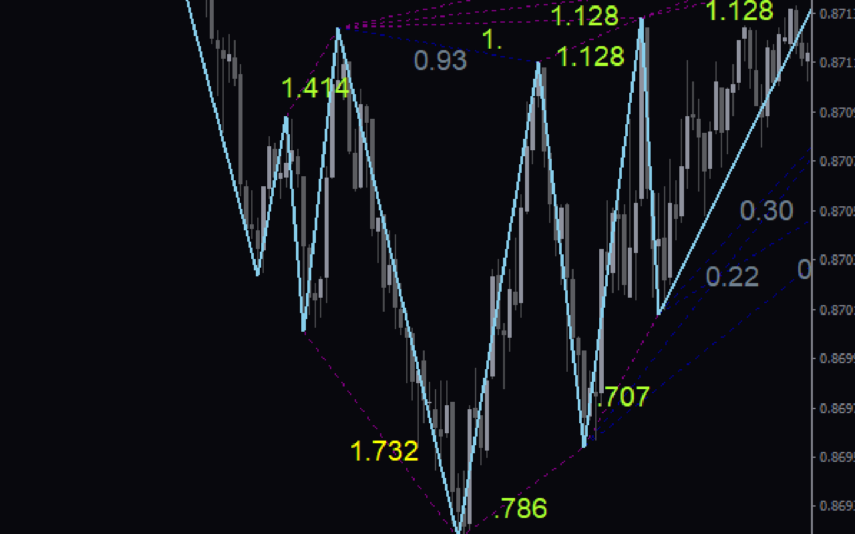
The Cypher Pattern Indicator is a free and popular Forex indicator for MT4 that is useful for traders looking to identify potential trading opportunities. The indicator works by plotting a series of lines on the chart that represent Fibonacci levels. The lines are then connected to form a pattern, which is the Cypher Pattern. This pattern is used to identify potential trading opportunities and can help traders determine potential entry and exit points.The indicator is easy to use and can help traders make more informed trading decisions.
Trend DashBoard
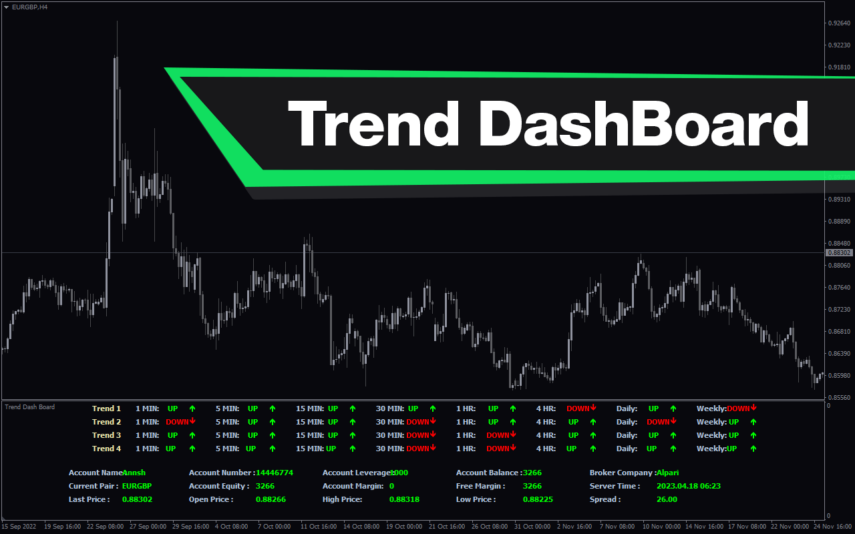
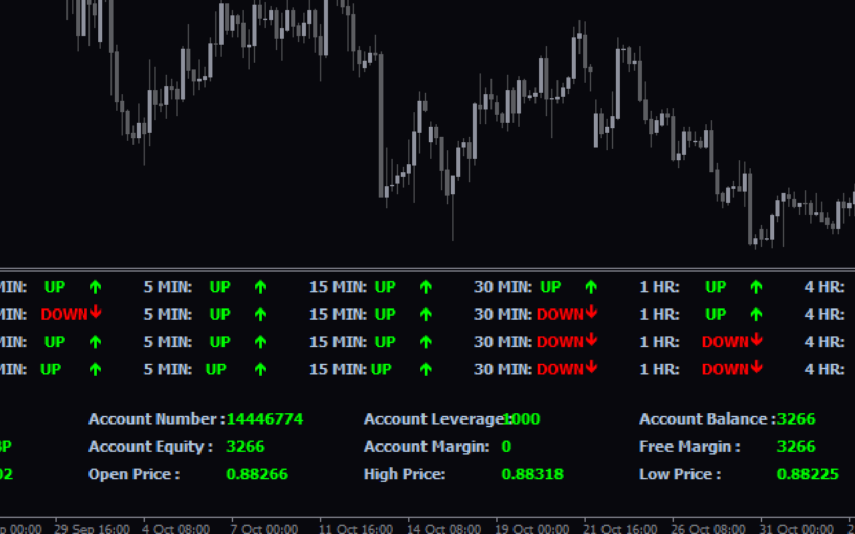
The Trend Dashboard Indicator is a powerful MT4 tool for forex traders who want to keep track of multiple currency pairs and timeframes on one chart. The indicator uses a dashboard to display the trend direction and strength for different currency pairs and timeframes. It also includes an alert feature that can notify traders of potential trading opportunities. With this indicator, traders can save time and stay on top of market trends, allowing them to make informed trading decisions.
Sideways Detector
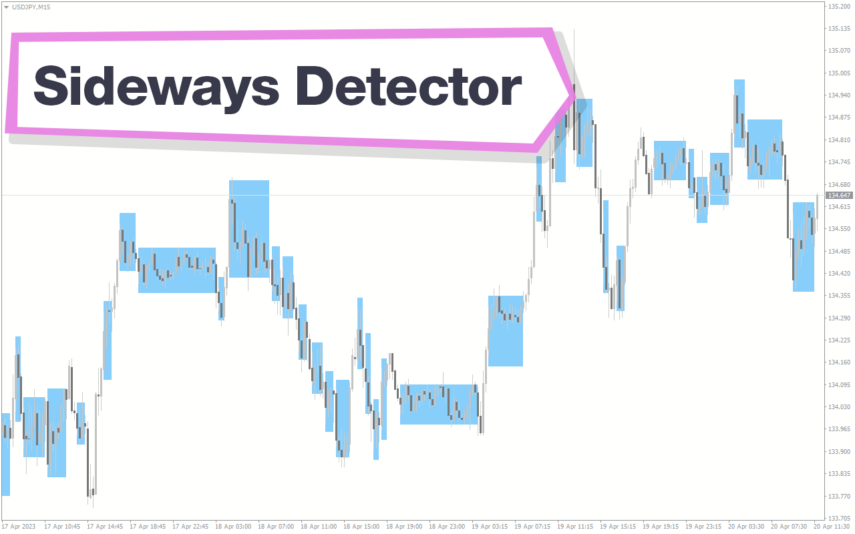
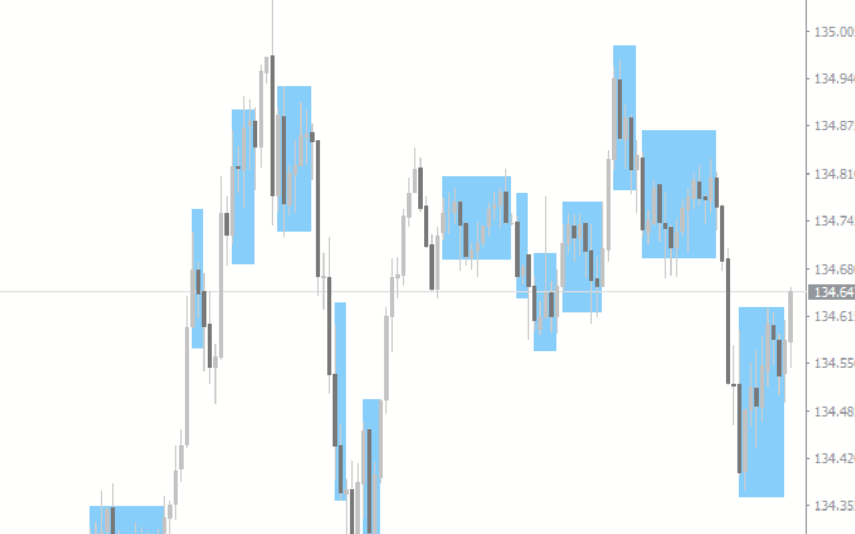
The Sideways Detector Indicator is a powerful and free forex indicator for MT4 that helps traders identify sideways market conditions in real time. It works by analyzing the behavior of the market price and identifying periods of consolidation, range movements and lack of a trend. Traders can use this information to adjust their trading strategies accordingly and avoid unnecessary losses. It is a useful tool for traders of all levels who want to improve their trading performance by staying ahead of market trends.
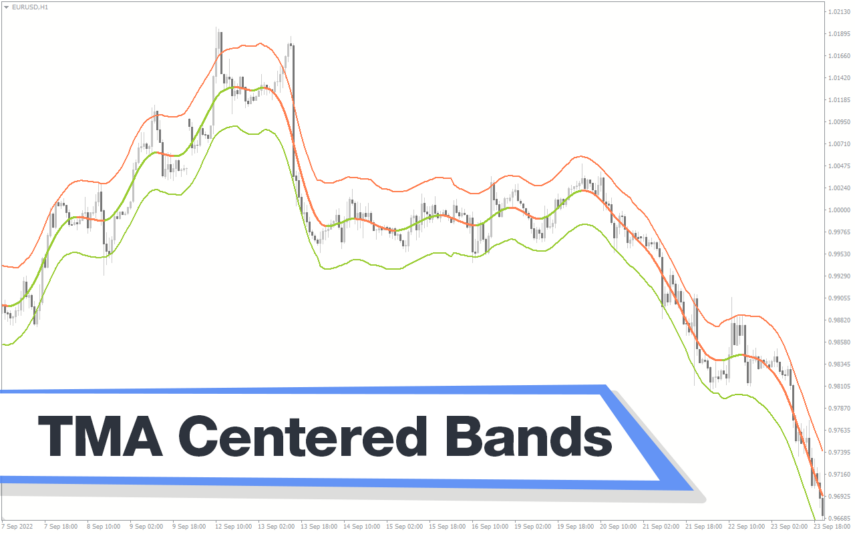
TMA Centered Bands
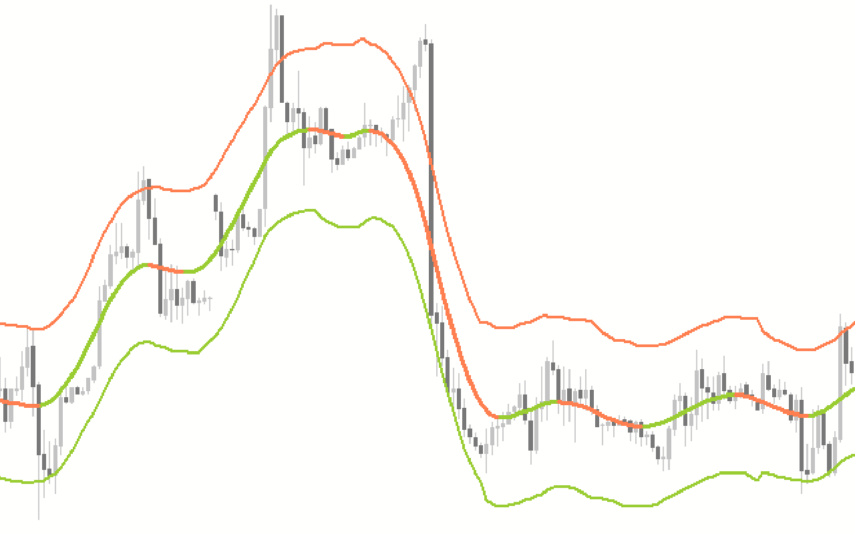
The TMA Centered Bands indicator is a powerful forex indicator available for the MT4 platform. This indicator was created for the MT4 platform and helps traders identify trends, support and resistance levels. The TMA Centered Bands indicator works by using a centered TMA (triangular moving average) to create a set of bands around the price. With a simple yet effective design, the TMA Centered Bands indicator is a valuable tool for any forex trader looking to improve their trading strategy.
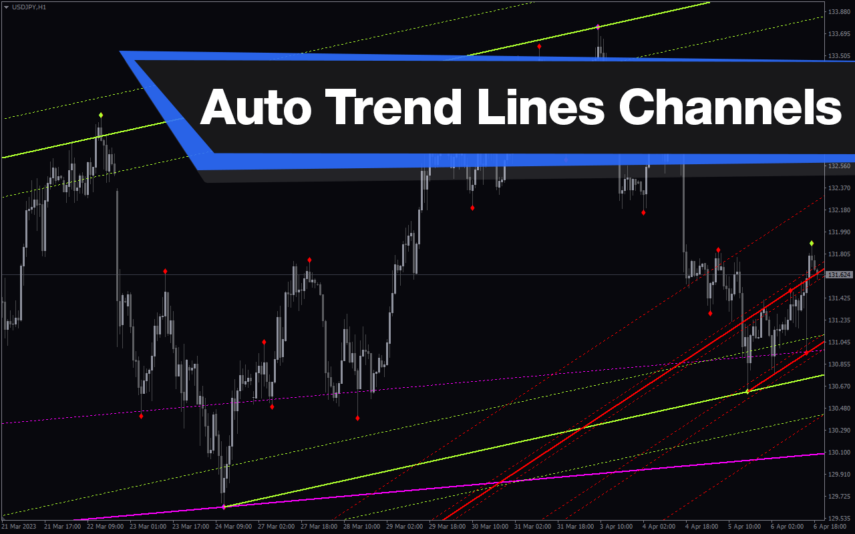
Auto Trend Lines Channels
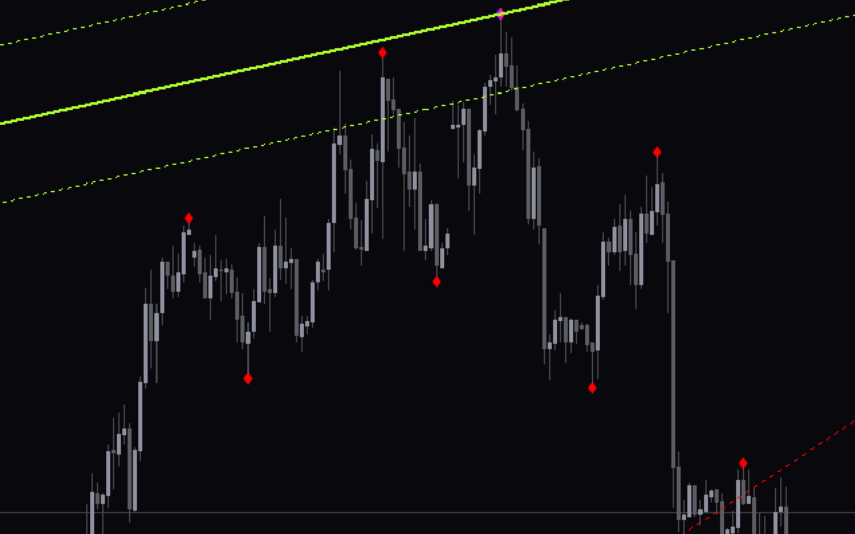
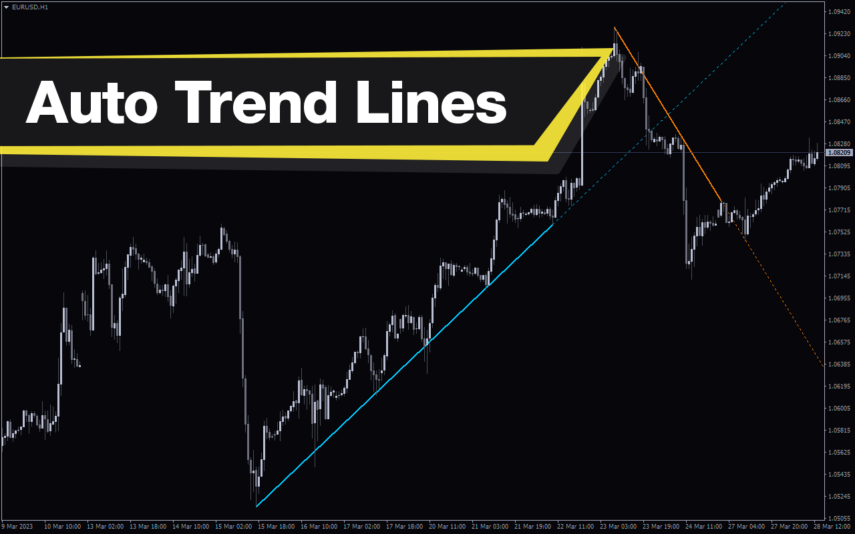
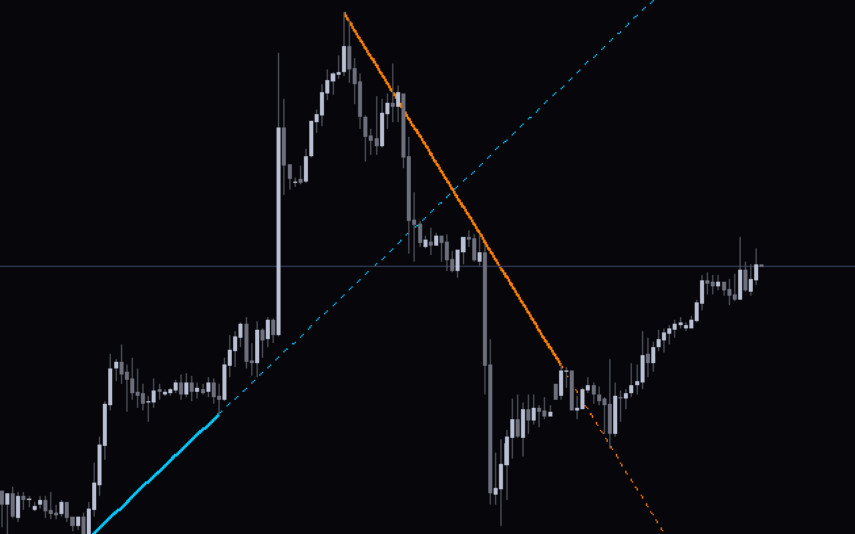
The Auto Trend Lines and Channels Indicator is a popular and free technical analysis tool for traders who use MT4 platform. This indicator automatically draws trend lines and channels on the chart, saving traders time and effort in manually drawing and adjusting these lines.The Auto Trend Lines and Channels Indicator is easy to use, and it works by analyzing the market price action to identify key support and resistance levels.

Reviews
There are no reviews yet.