
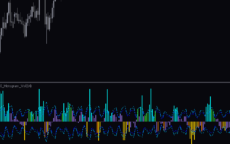
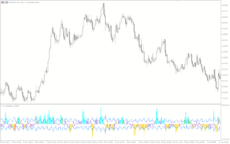
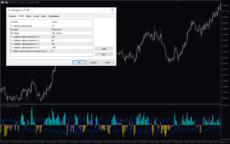
The CCI Histogram Volume Indicator MT5 is a free and popular Forex indicator that is useful for traders of all levels. The indicator is designed to help traders identify market trends and potential entry and exit points. It works by measuring the volume of price movements in relation to the volume of price movements in the past. The indicator is based on the Commodity Channel Index (CCI) and uses a histogram to display the volume of price movements. The CCI Histogram Volume Indicator MT5 is a versatile tool that can be used in various ways. It can be used to identify market trends, and to spot potential entry and exit points. Traders can use the indicator to identify overbought and oversold conditions, and to identify potential breakouts and reversals. The indicator can also be used to identify support and resistance levels, and to identify potential trading opportunities. It can also be used to identify overbought and oversold conditions, and to identify potential breakouts and reversals. The indicator is an invaluable tool for any Forex trader.
MT5


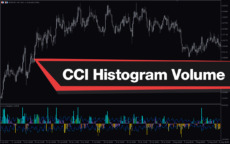
CCI Histogram Volume
The CCI Histogram Volume Indicator MT5 is a popular and free Forex indicator that is useful for traders of all levels. This indicator is based on the Commodity Channel Index (CCI) and uses a histogram to measure the strength of the trend. This indicator is a great tool for traders who want to identify the strength of the trend and make informed trading decisions.
| Trading Style | , |
|---|---|
| Indicator Type | |
| Timeframe | , |
| Platform |
0
People watching this product now!
Downloads - 30
Description
Reviews (0)
How to Install
Related products
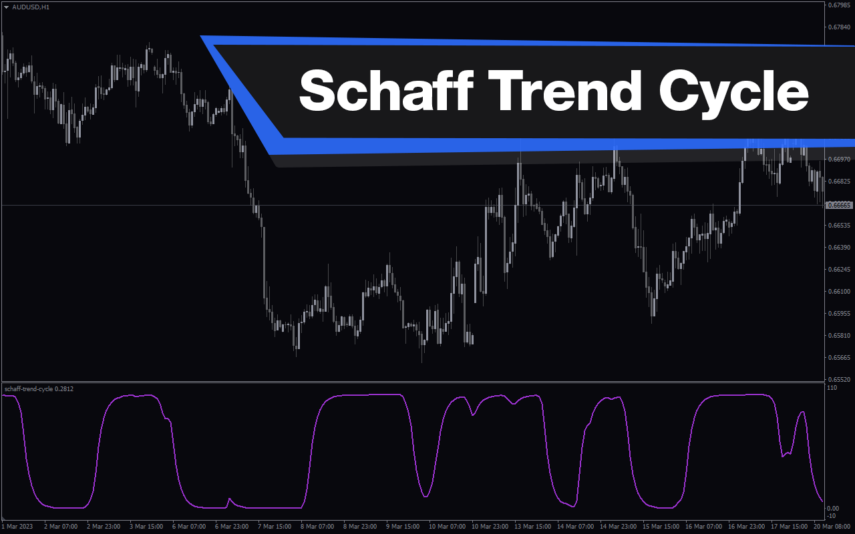
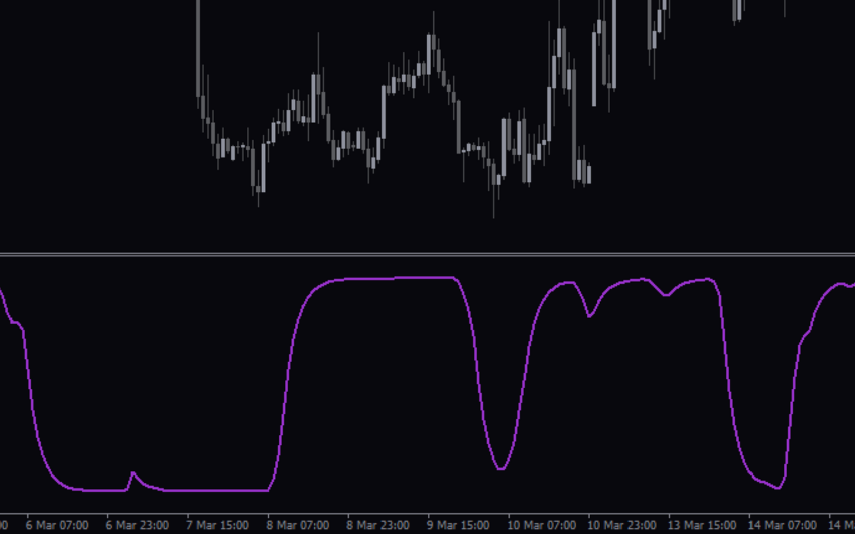
Schaff Trend Cycle
The Schaff Trend Cycle indicator is a popular forex indicator for MT4, which determines market trends with high accuracy. Its values range from 0 to 100, with values above 75 indicating overbought and values below 25 indicating oversold. Whether you are a beginner or an experienced trader, the Schaff Trend Cycle indicator will help you make better trading decisions and improve profitability.
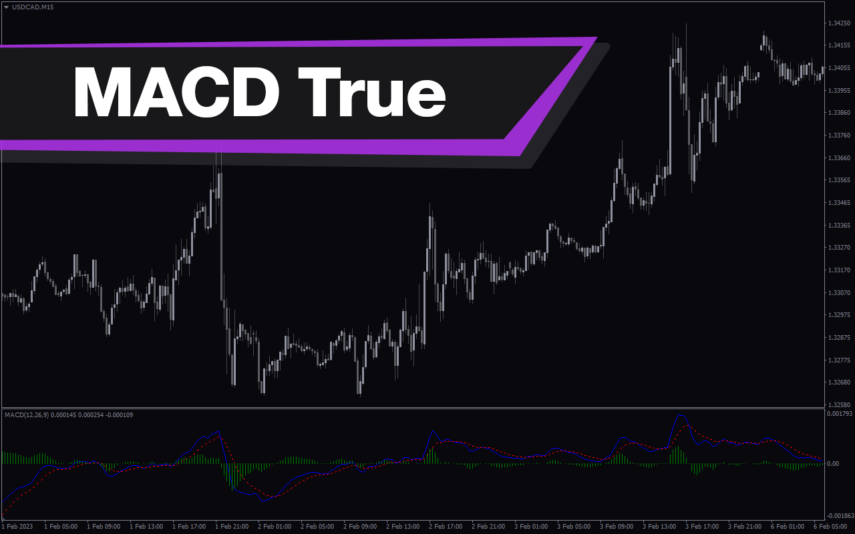
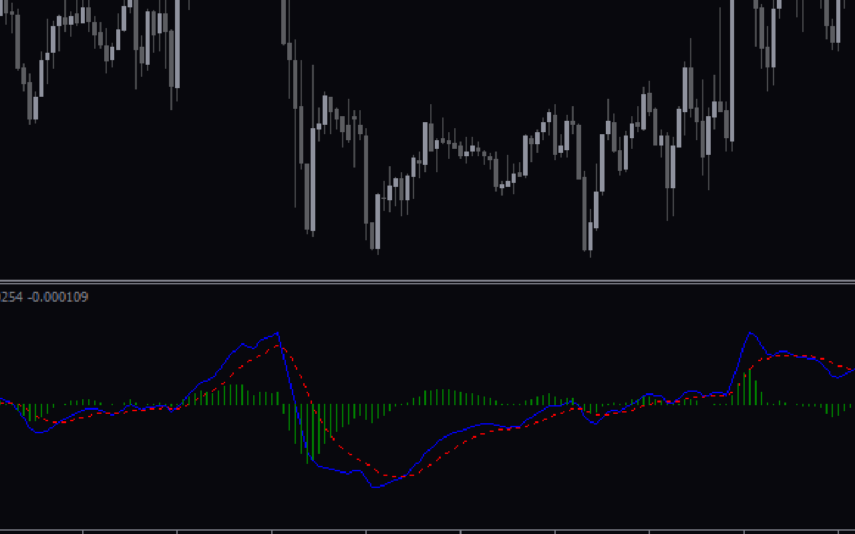
MACD True
The MACD True Indicator is a popular and useful MT4 forex indicator that helps traders identify trends and momentum in the market. It is a modified version of the traditional MACD indicator that incorporates a color-coded histogram to provide more visual cues for traders. This indicator works by measuring the difference between two moving averages, and it is often used in conjunction with other technical indicators to confirm trading signals. Traders of all levels can benefit from using the MACD True Indicator in their trading strategies.
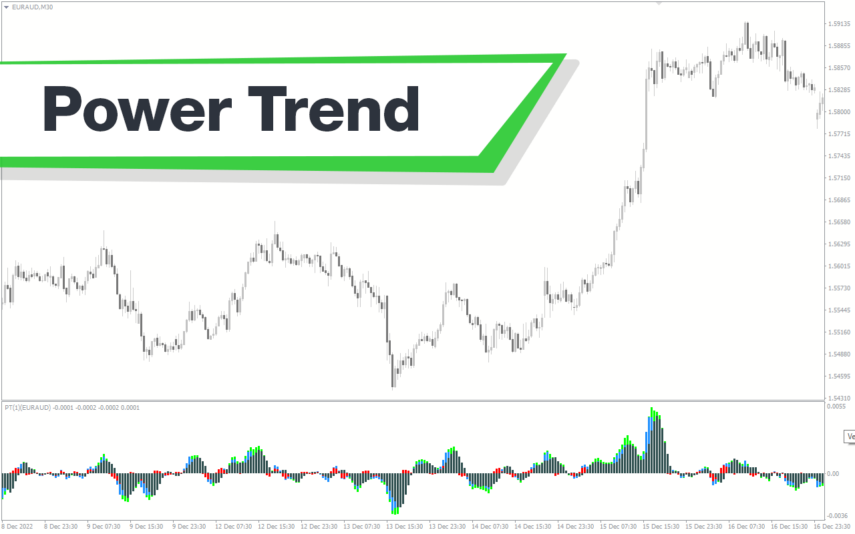
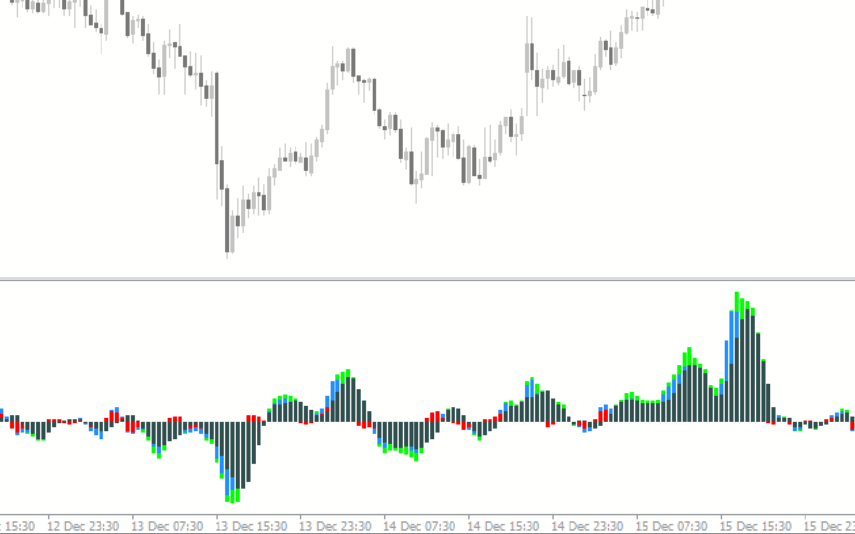
Power Trend
The Power Trend indicator for MT4 is a new and free popular forex technical analysis tool that helps traders identify trends, their direction, and strength visually in different colors. The colored histogram of the Power Trend indicator helps traders plan their trading strategies by providing insights into the trend's strength and maturity level. The indicator changes color to indicate weak or strong trends, allowing traders to maximize their profits and exit the trade at the right time. Download the Power Trend indicator for free and enhance your trading experience.
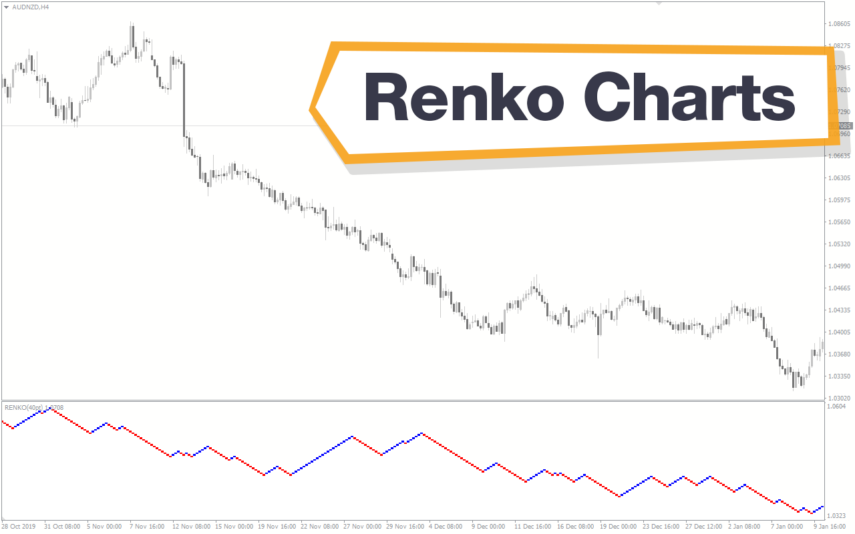
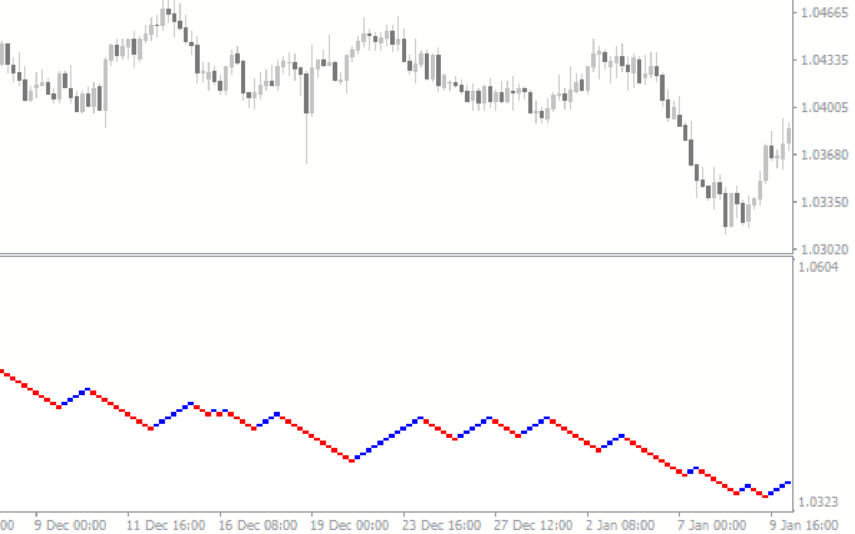
Renko Charts
The Renko Charts indicator is a popular free MT4 tool used by forex traders to analyze market trends. It works by plotting price movements as "bricks" on a chart, where each brick represents a predetermined price range. This helps filter out market noise and highlight the direction of the trend. Make The Renko Charts indicator a useful tool to improve your Forex trading strategies.
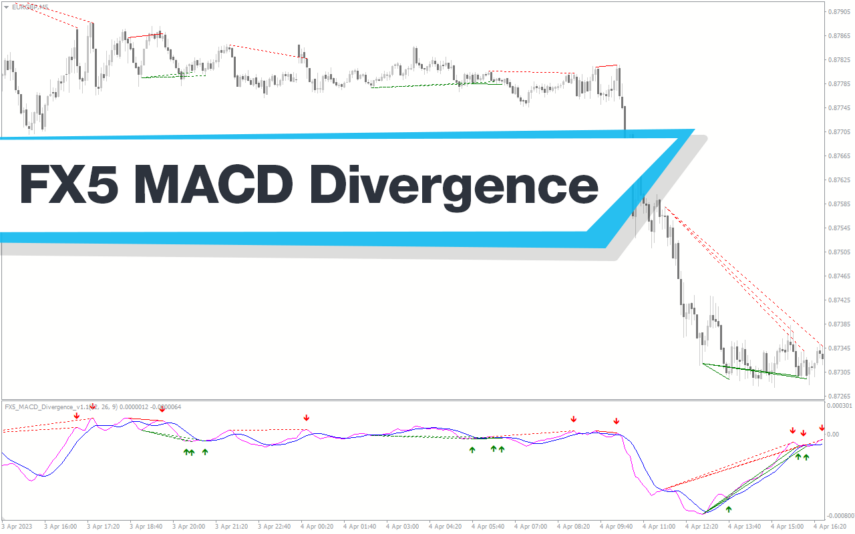
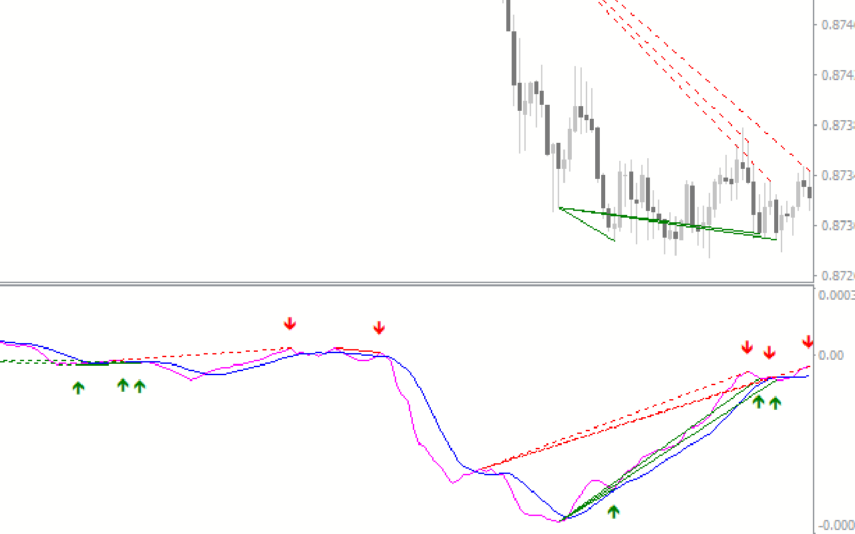
FX5 MACD Divergence
The MACD FX5 Divergence Indicator is a new and popular forex indicator that runs on the MT4 platform. This is a free indicator that traders can use to identify potential trend reversals and momentum shifts. The indicator is based on the Moving Average Convergence-Divergence (MACD) indicator, which measures the distance between two moving averages. It analyzes the divergence between the MACD indicator and price action and then generates buy or sell signals. Use this indicator to better understand market trends and take advantage of potential profit opportunities.
Reviews
There are no reviews yet.