
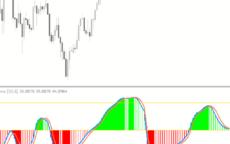
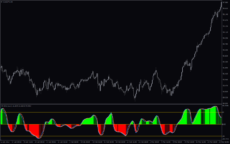
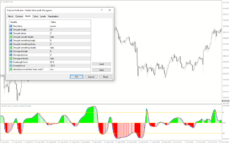
The Better DMX Jurik Histogram Indicator is a useful and popular free Forex indicator for MT4. It is designed to help traders identify potential buy and sell signals in the Forex market. The indicator works by displaying a histogram of the price action in the market. The histogram is composed of two lines: a red line that represents the current price action, and a green line that represents the average price action. The two lines cross each other when the current price action is above or below the average price action. When the red line is above the green line, it indicates a potential buy signal, and when the red line is below the green line, it indicates a potential sell signal. The indicator also displays a trend line that helps traders identify the current trend in the market. The trend line is composed of two colors: yellow and blue. The yellow line indicates an uptrend, while the blue line indicates a downtrend. The indicator also includes a range bar that helps traders identify the range of the current price action. The range bar is composed of three colors: red, green, and blue. The red bar indicates a strong trend, while the green and blue bars indicate a weaker trend. The Better DMX Jurik Histogram Indicator is a useful and popular free Forex indicator for MT4 that helps traders identify potential buy and sell signals in the Forex market.
MT4


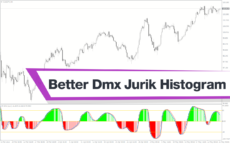
Better Dmx Jurik Histogram
The Better DMX Jurik Histogram Indicator is a useful and popular free Forex indicator for MT4. The indicator uses a combination of histogram and moving average to plot a signal line, and to identify possible trend reversals. It is easy to use, as it only requires traders to set the parameters, and to observe the signal line. It is also easy to install and use, making it a great choice for beginners.
| Indicator Type | |
|---|---|
| Trading Style | , , |
| Timeframe | |
| Platform |
0
People watching this product now!
Downloads - 99
Description
Reviews (0)
How to Install
Related products
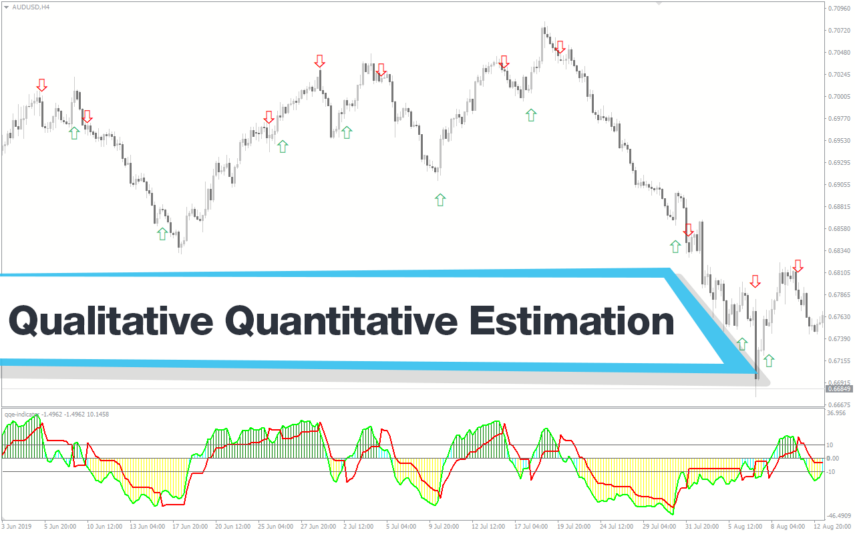
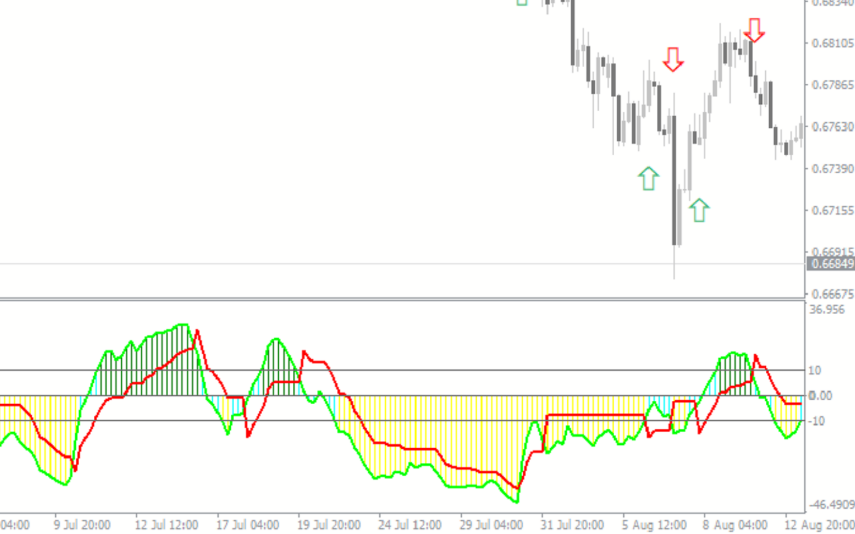
Qualitative Quantitative Estimation
The Qualitative Quantitative Estimation Indicator is a powerful tool for traders in the Forex market. It's a new and popular indicator that works with the MT4 platform. The QQE Indicator is used to determine market trends, identify overbought and oversold positions, and detect divergence in prices and momentum.
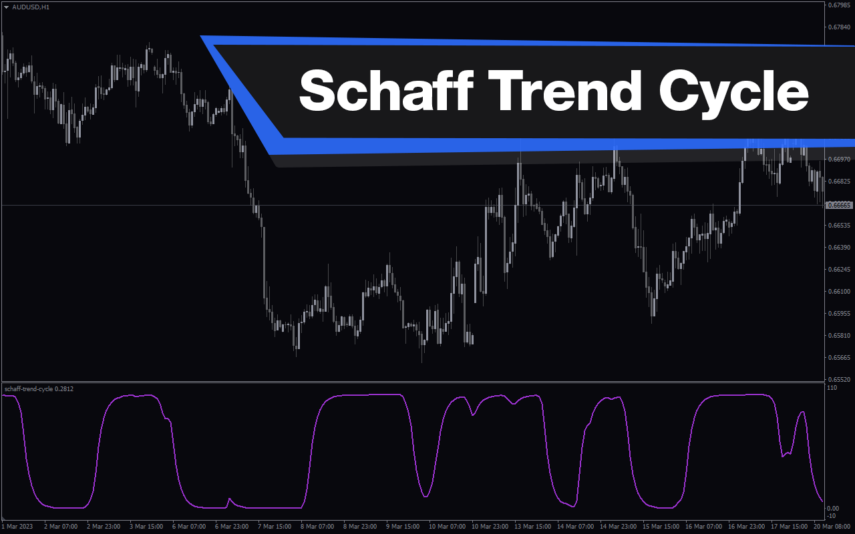
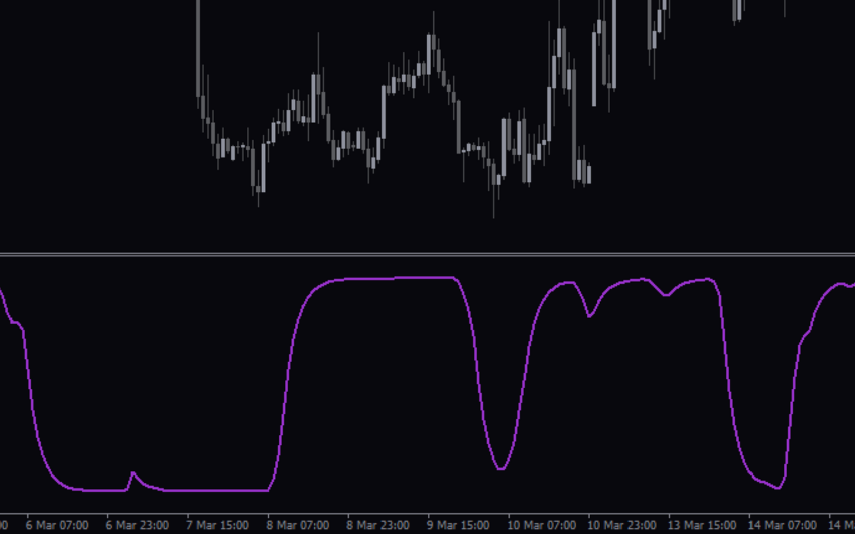
Schaff Trend Cycle
The Schaff Trend Cycle indicator is a popular forex indicator for MT4, which determines market trends with high accuracy. Its values range from 0 to 100, with values above 75 indicating overbought and values below 25 indicating oversold. Whether you are a beginner or an experienced trader, the Schaff Trend Cycle indicator will help you make better trading decisions and improve profitability.
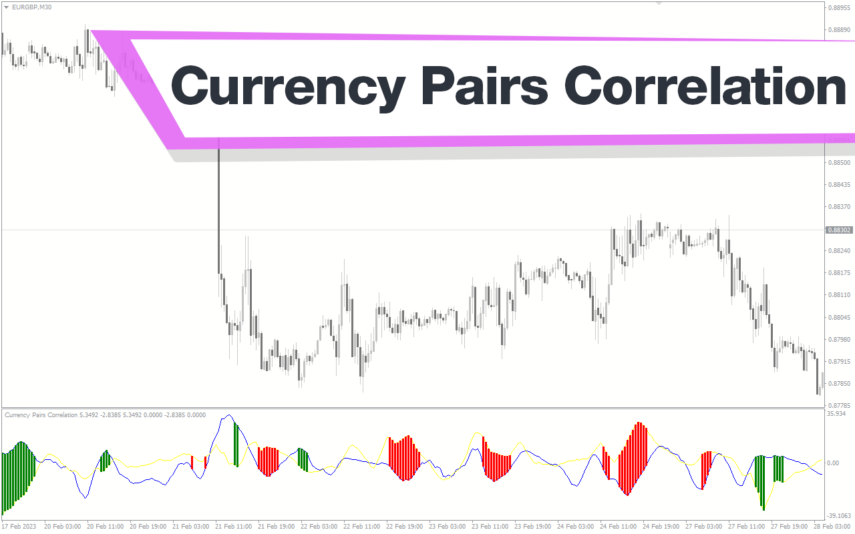
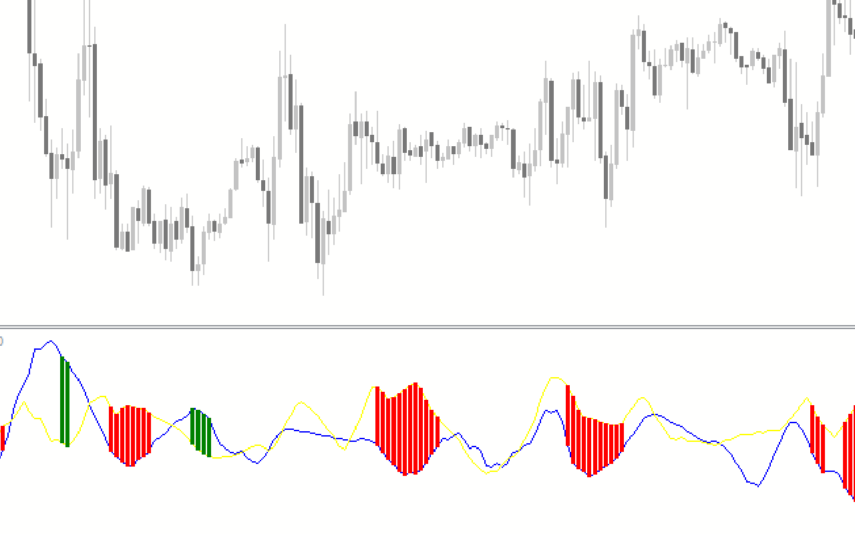
Currency Pairs Correlation
The Currency Pairs Correlation indicator is a free and popular tool for forex traders available on MT4 platform. It shows the correlation between various currency pairs, helping traders identify potential trading opportunities and manage their portfolio risk. The indicator calculates correlation coefficient between selected currency pairs and displays it as a color-coded matrix. The Currency Pairs Correlation indicator can be used by both novice and experienced traders to get a better understanding of market dynamics and make more informed trading decisions.
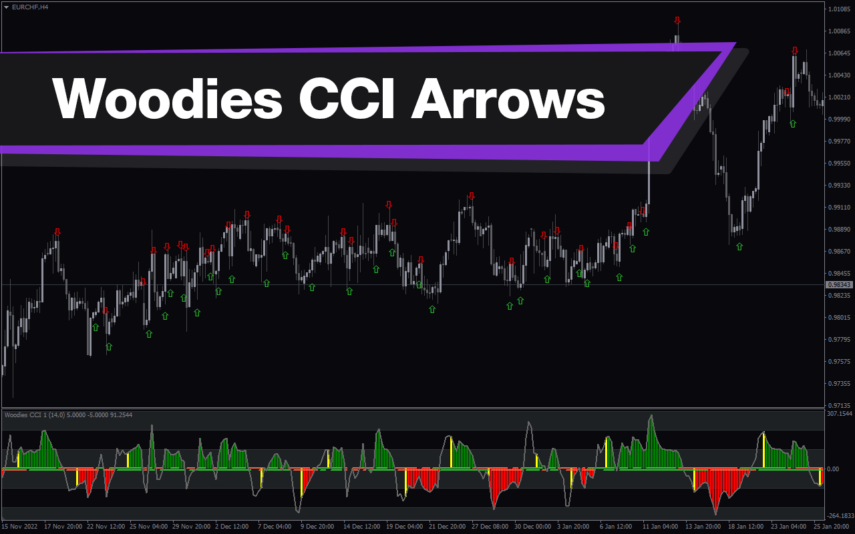
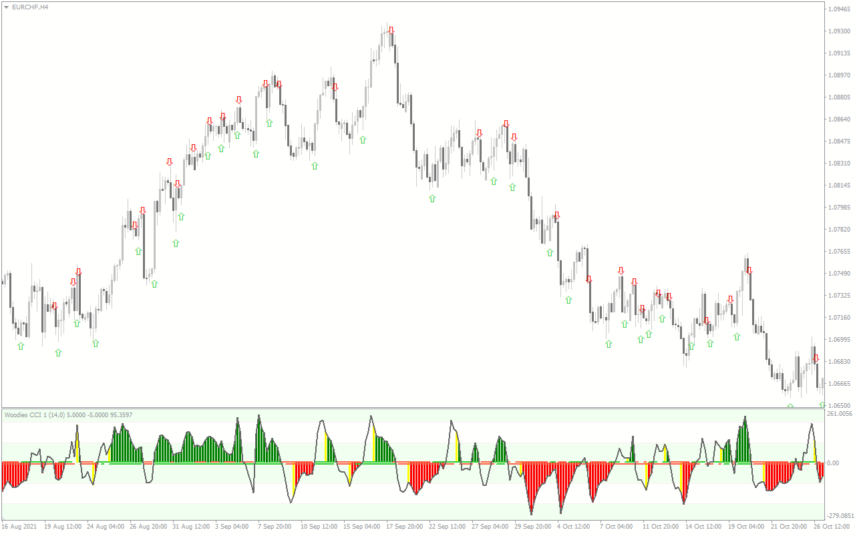
Woodies CCI Arrows Oscillator
The Woodies CCI Arrows Oscillator Indicator is a popular MT4 technical analysis tool used by forex traders to identify trends and potential entry and exit points wich based on the Woodies CCI system, which helps traders to identify when a trend is strong and when it may be weakening. The arrows on the indicator show when the price is moving in a particular direction, and the oscillator provides additional confirmation of the trend's strength. The Woodies CCI Arrows Oscillator Indicator is a valuable addition to any trader's toolkit, and it can help traders make better-informed trading decisions.
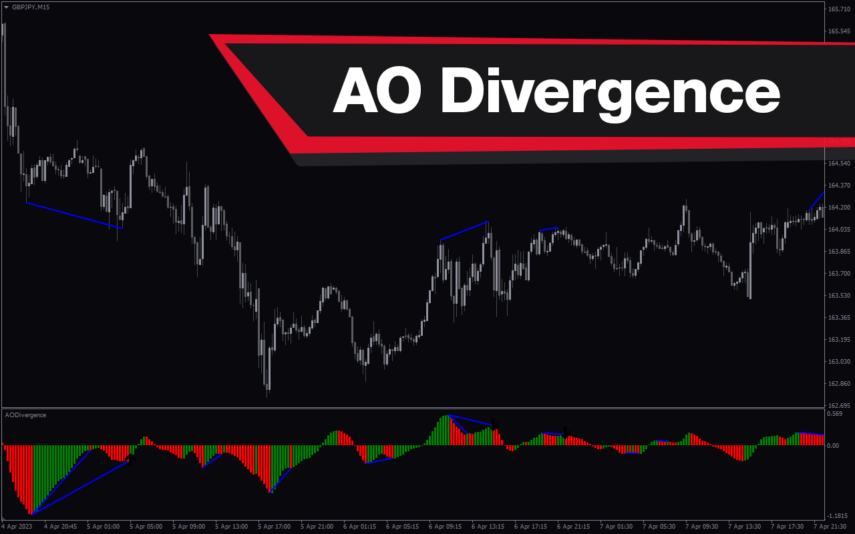
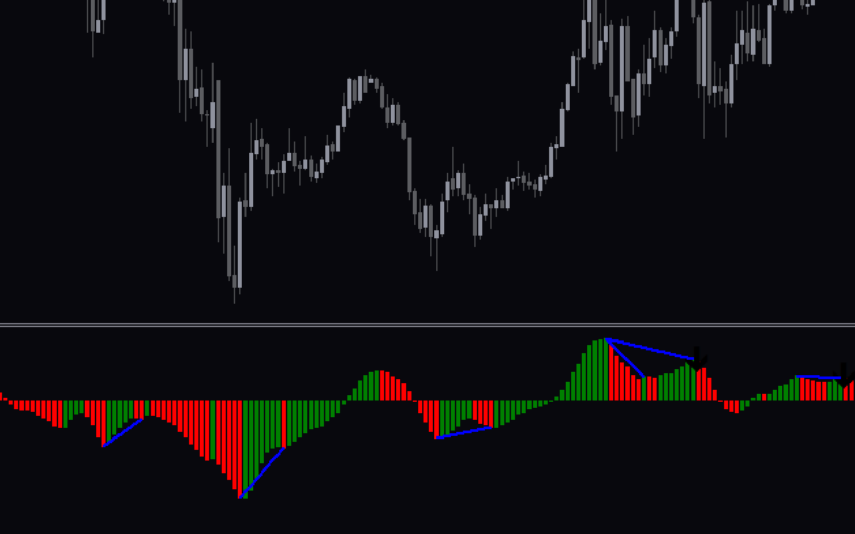
AO Divergence
The AO Divergence Indicator is a useful BE4 tool for forex traders who want to identify divergence patterns in the market. This new MT4 indicator is popular with traders due to its effectiveness in spotting divergence patterns and predicting potential price reversals. It works by analyzing the Awesome Oscillator (AO) and highlighting divergence patterns that may indicate possible trend changes. The AO Divergence Indicator is easy to use and can be a valuable addition to any trader's toolbox.
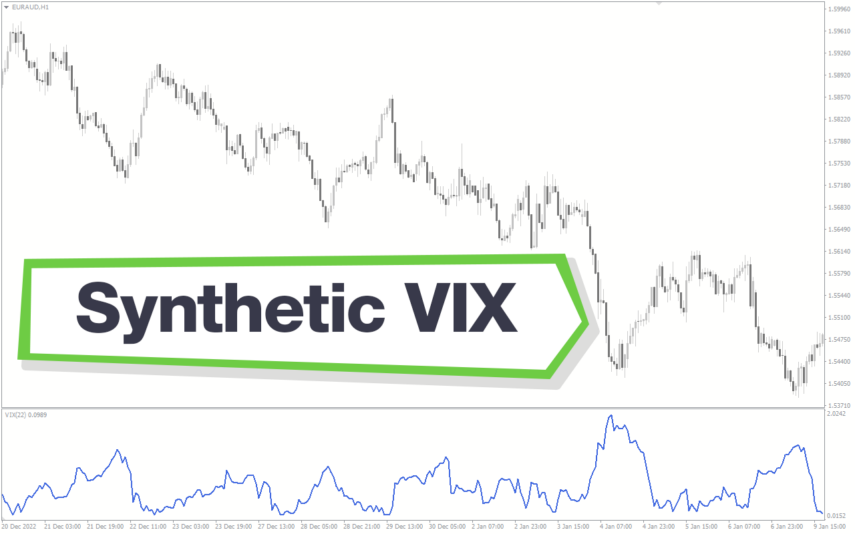
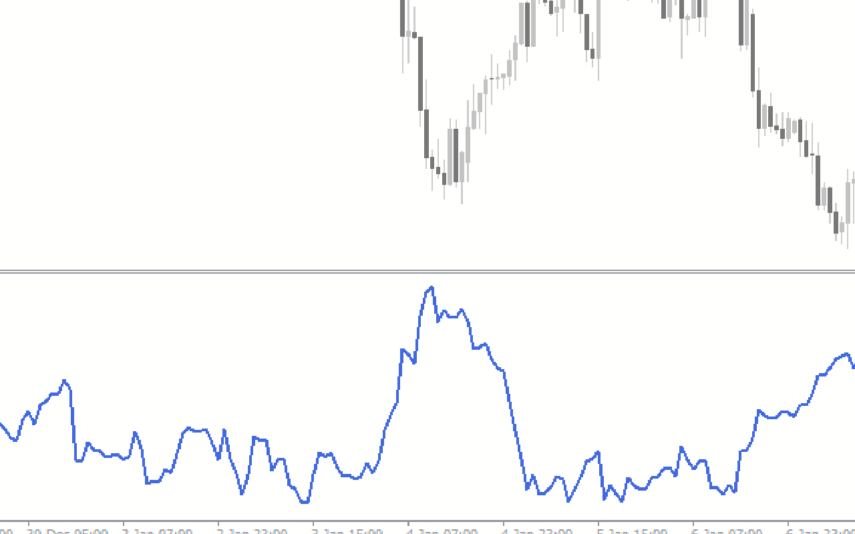
Synthetic VIX
The Synthetic VIX Indicator is a popular and free Forex indicator for the MT4 trading platform. The indicator utilizes a combination of price action and signals from multiple time frames to accurately predict market movements. The Synthetic VIX indicator can be used to identify potential entry and exit points in the market, as well as to identify trend reversals and breakouts. It is designed to provide traders with an easy to use and reliable indicator that can help them make informed trading decisions. With its accurate and reliable signals, the Synthetic VIX Indicator is a great tool for any trader looking to improve their trading performance.
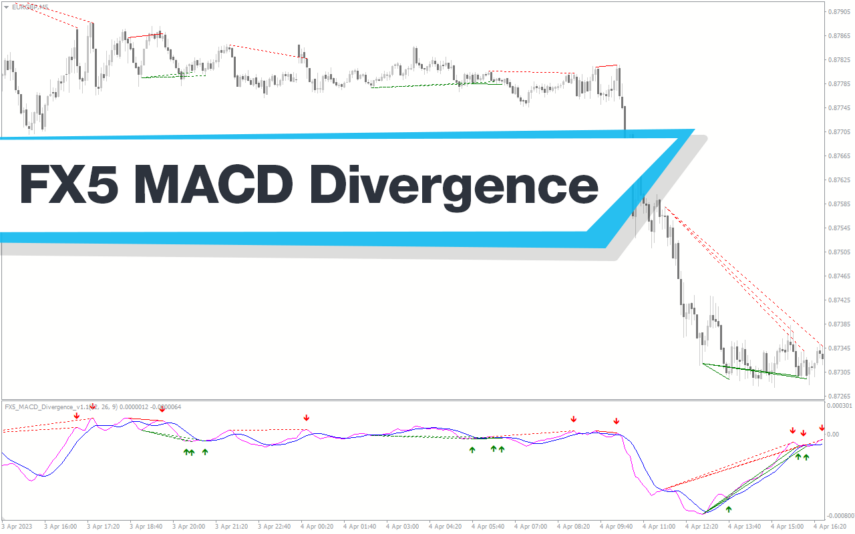
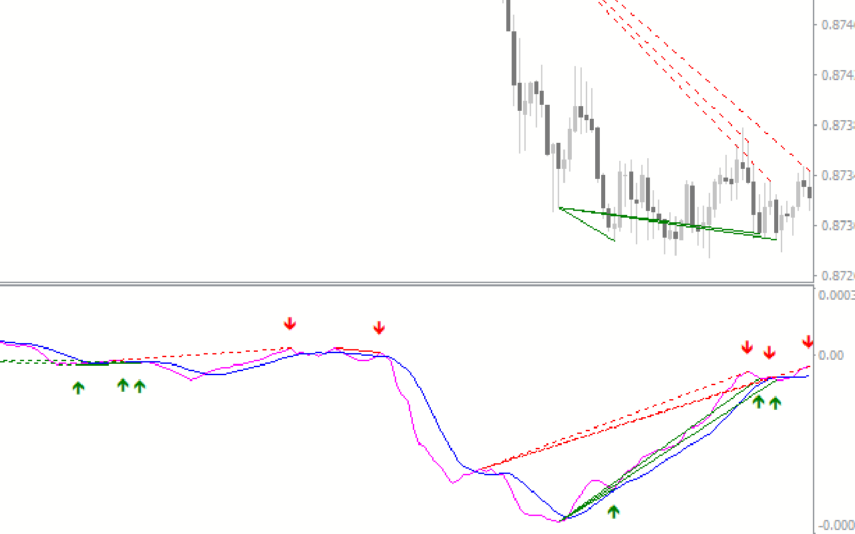
FX5 MACD Divergence
The MACD FX5 Divergence Indicator is a new and popular forex indicator that runs on the MT4 platform. This is a free indicator that traders can use to identify potential trend reversals and momentum shifts. The indicator is based on the Moving Average Convergence-Divergence (MACD) indicator, which measures the distance between two moving averages. It analyzes the divergence between the MACD indicator and price action and then generates buy or sell signals. Use this indicator to better understand market trends and take advantage of potential profit opportunities.
Reviews
There are no reviews yet.