
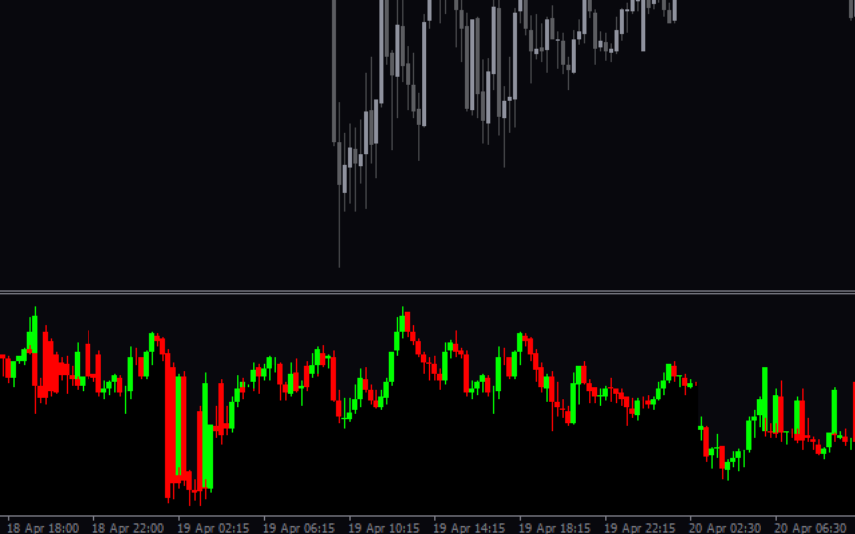
The Cumulative Delta Indicator for MT5 is a popular forex indicator that is widely used by traders to analyze market dynamics and identify potential trading opportunities. This indicator is highly useful for tracking the volume flow in the market and can help traders make more informed trading decisions. The Cumulative Delta Indicator works by calculating the difference between the buying and selling volumes for each price bar and then cumulatively adding up these values over time. By monitoring the cumulative delta values, traders can gain valuable insights into the overall buying or selling pressure in the market. To use the Cumulative Delta Indicator, traders can look for divergences between price movements and cumulative delta values, which can signal potential trend reversals. Additionally, traders can also use the indicator to confirm the strength of a trend by looking for confirmation from the cumulative delta values. Best of all, this powerful indicator is available for free on MT5, making it accessible to all forex traders.
MT5


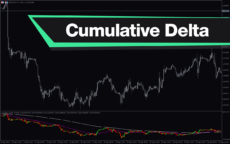
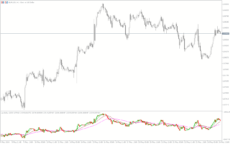
Best Cumulative Delta
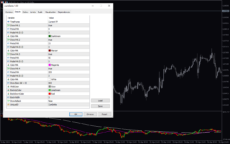
The Best Cumulative Delta Indicator for MT5 is a useful tool for forex traders. This popular indicator is free to use and shows the cumulative volume of trades at each price level. Traders can use this information to gauge market strength and potential price movements. To use the indicator, simply add it to your MT5 platform and observe the changes in cumulative delta over time.
| Indicator Type | |
|---|---|
| Trading Style | , |
| Platform | |
| Timeframe | , |
0
People watching this product now!
Downloads -
Description
Reviews (0)
How to Install
Related products
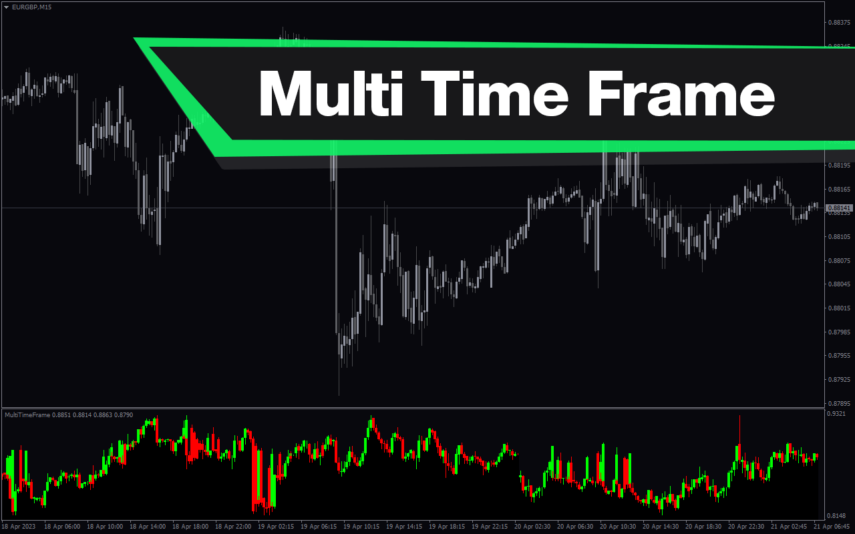
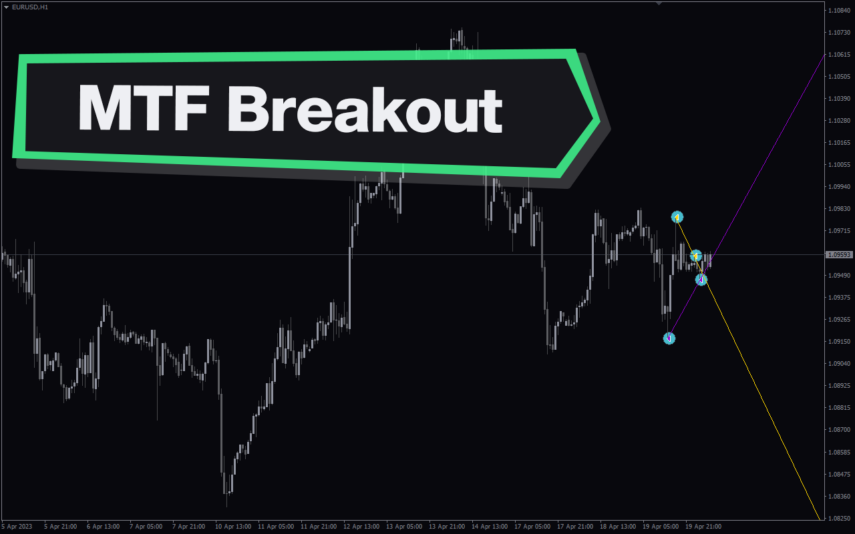
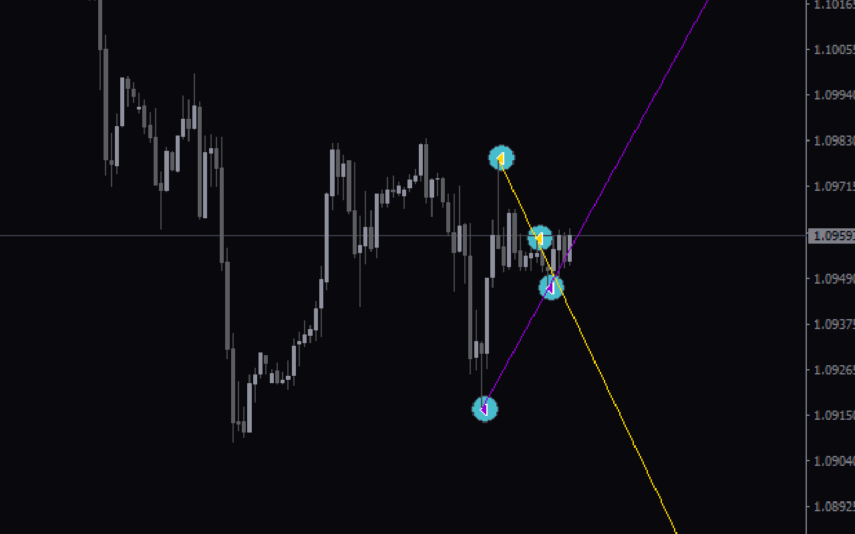
Multi Time Frame Breakout
The Multi-Time Frame Breakout indicator is a new and popular forex indicator that is available for free on the MT4 platform. This indicator helps traders identify breakout points by analyzing multiple timeframes at the same time. It works by plotting support and resistance levels based on the highest and lowest price levels over multiple time frames. This is a valuable tool for traders who use multiple timeframes in their analysis and want to improve their accuracy in identifying potential breakout points.
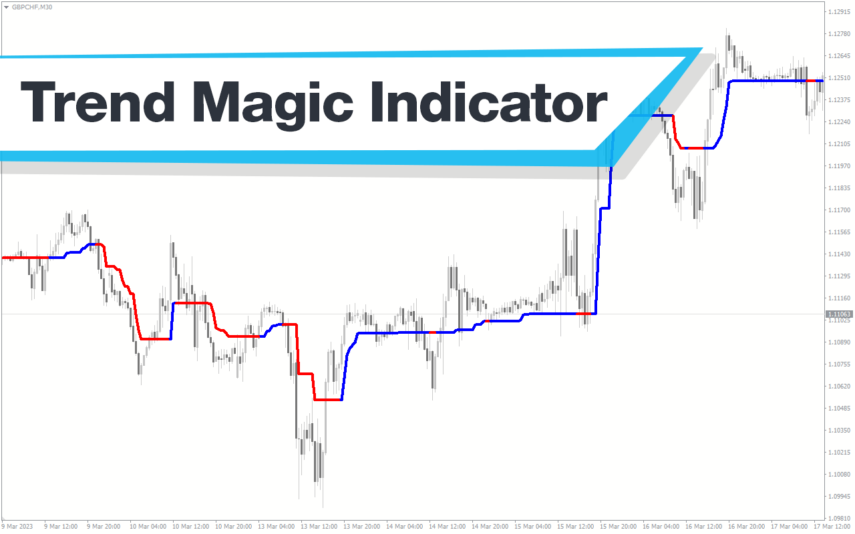
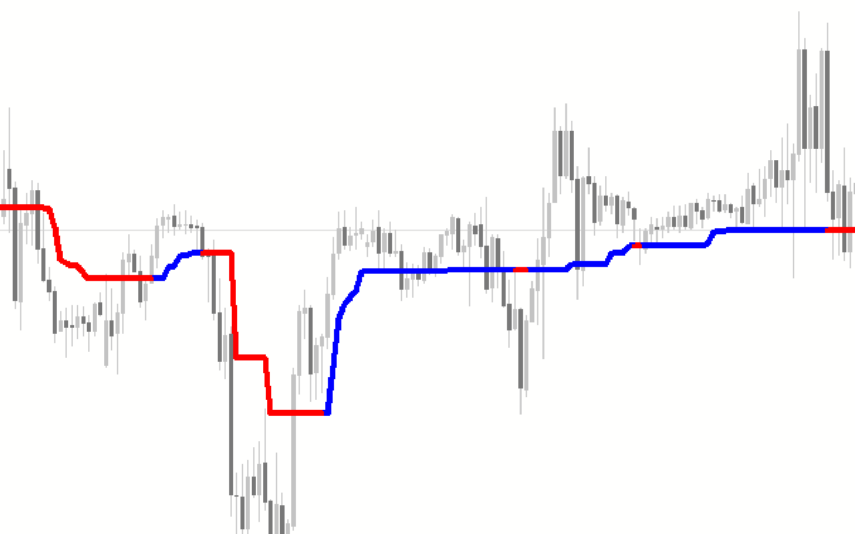
Trend Magic
The Trend Magic Indicator is a popular, free forex MT4 indicator that uses a combination of moving averages and filters to identify the trend direction and potential trade opportunities. The indicator appears as a line that changes color according to the current trend direction. The green color indicates a bullish trend, while the red color indicates a bearish trend. It is simple to use and can be a valuable tool for traders to identify potential entry and exit points in the market.
Reviews
There are no reviews yet.