
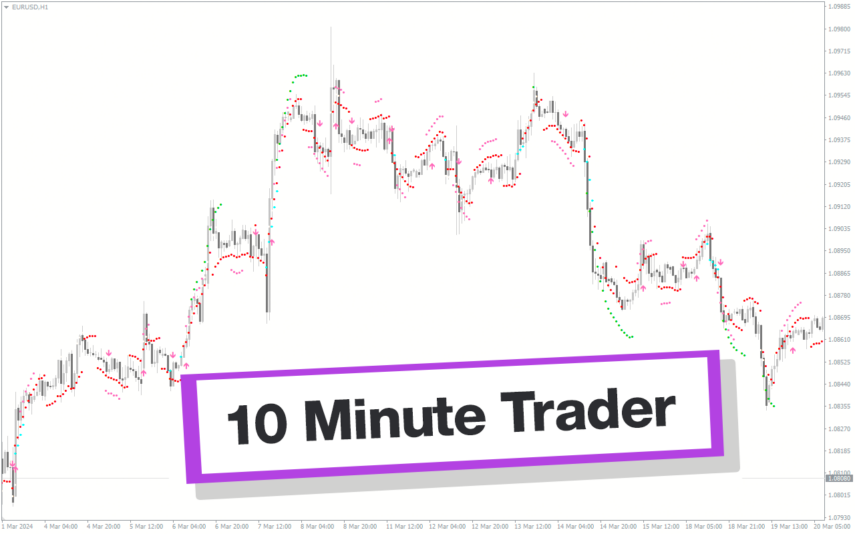
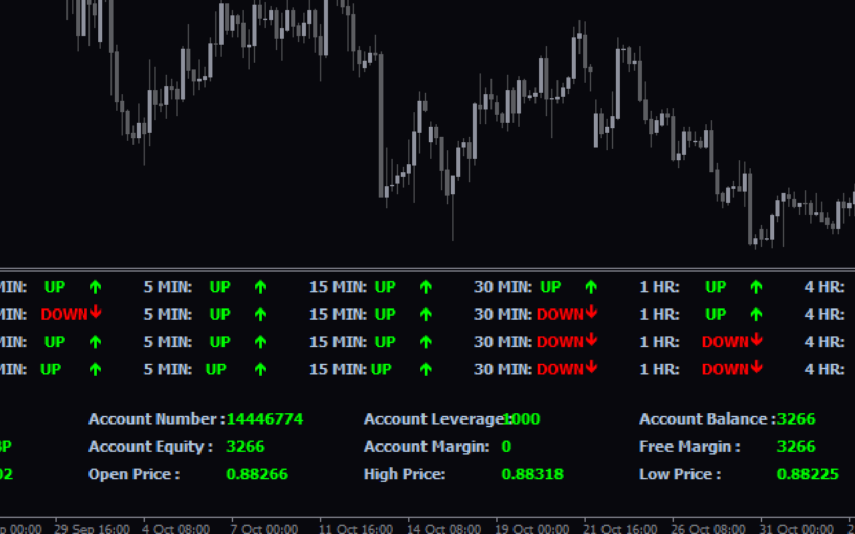
The AY MML Dashboard v1.1 NMC indicator is a useful tool for forex traders who use MT4. This popular indicator is free to download and can help traders identify potential trend reversals and key support and resistance levels. The indicator works by plotting multiple time frame multi-level support and resistance lines on the chart, making it easy to spot important price levels. Traders can use this information to make more informed trading decisions and adjust their strategies accordingly. To use the AY MML Dashboard v1.1 NMC indicator, simply download and install it on your MT4 platform. Once added to your chart, you can customize the settings to suit your trading style and preferences. This indicator is a valuable tool for any forex trader looking to improve their trading performance.
MT4


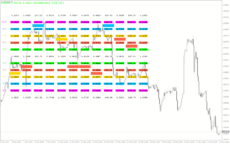
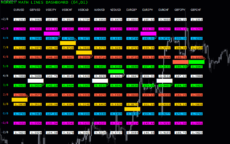
AY Mml Dashboard V1 1 Nmc
AY MML Dashboard v1.1 NMC Indicator is a useful forex indicator for MT4 that is popular among traders. It is a free tool that displays support and resistance levels based on Alan Andrews’ Median Line method. Traders can use this indicator to make more informed trading decisions by identifying key levels in the market. The indicator is easy to use and can be a valuable tool for analyzing price action.
| Platform | |
|---|---|
| Timeframe |
0
People watching this product now!
Downloads - 10
Description
Reviews (0)
How to Install
Related products
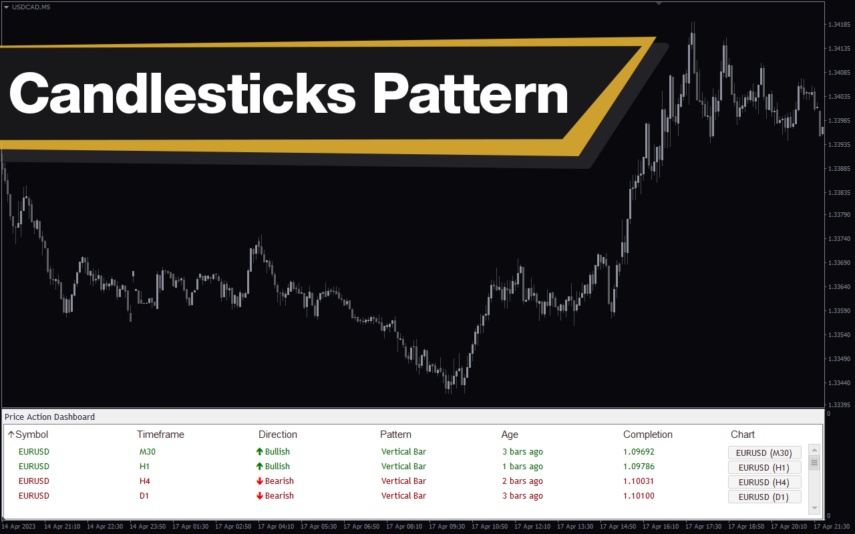
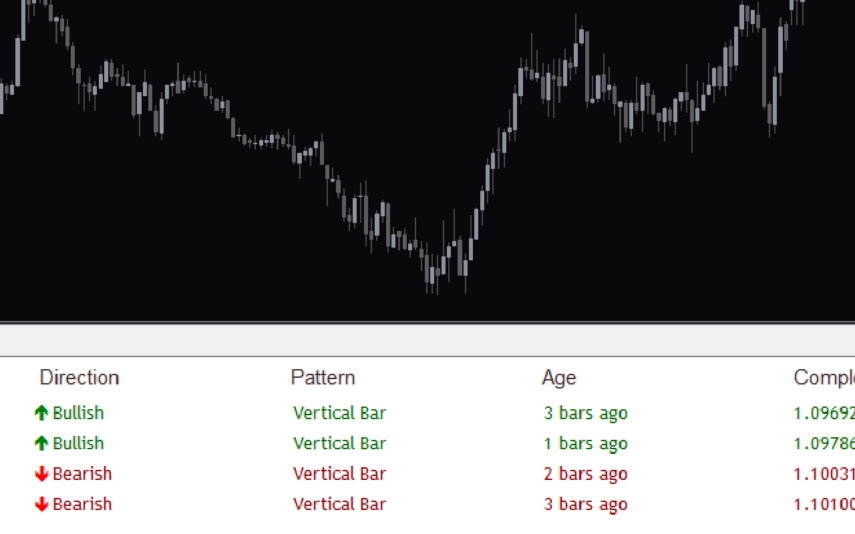
Candlesticks Pattern
The Candlesticks Pattern Indicator is a useful MT4 tool for Forex traders. The indicator works by scanning the market for different candlestick patterns, such as the Doji, Hammer and Shooting Star, and then displaying the patterns on the chart. With the Candlesticks Pattern Indicator, traders can quickly and easily identify potential trading opportunities, making it a valuable tool for anyone looking to make successful trades in the Forex market.

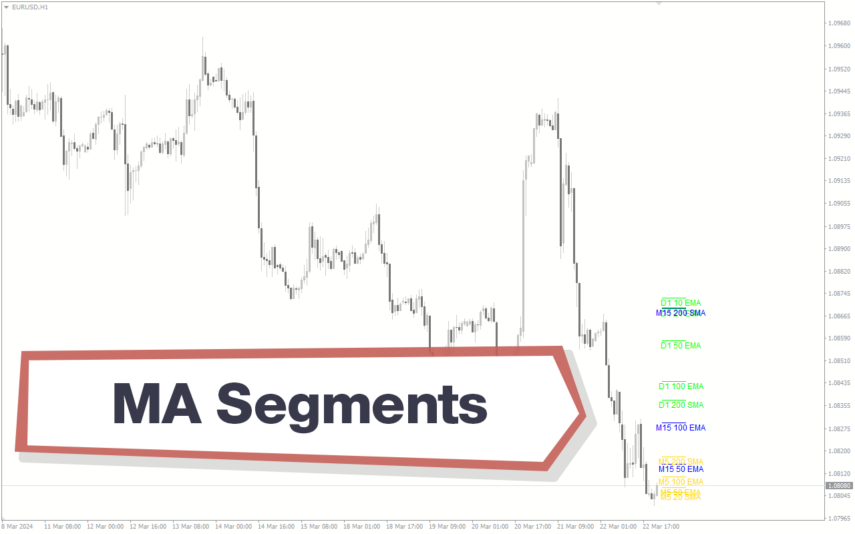
MA Trend
The MA Trend Indicator is a popular and free Forex indicator for the MT4 trading platform. It is a useful tool that helps traders identify the trend direction of a currency pair. The indicator plots two moving averages, one fast and one slow, to help identify the trend. When the fast moving average is above the slow moving average, it indicates an uptrend, and when the fast moving average is below the slow moving average, it indicates a downtrend. It is a great way to help traders identify the trend direction of a currency pair, which can help them make more profitable trades.
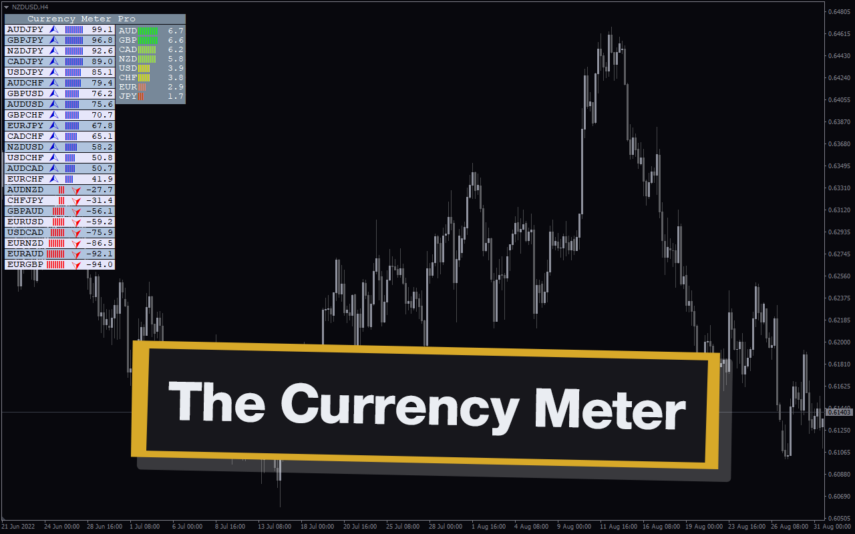
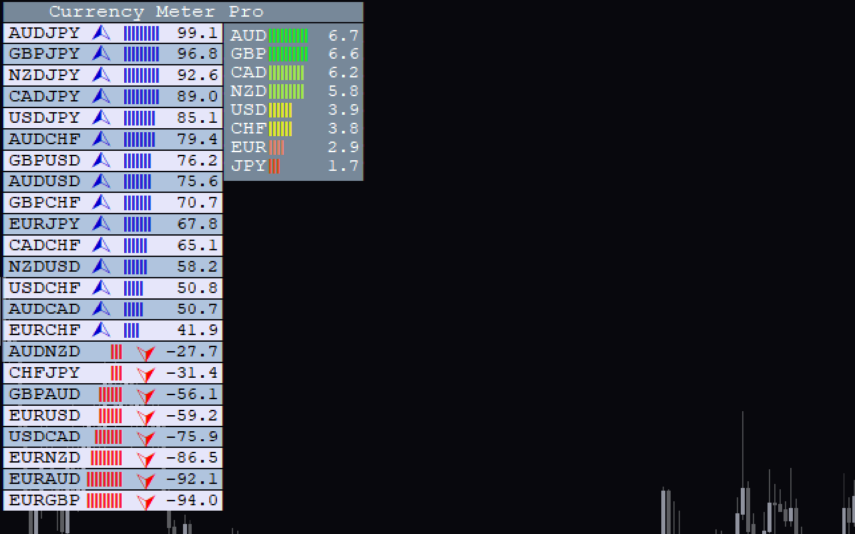
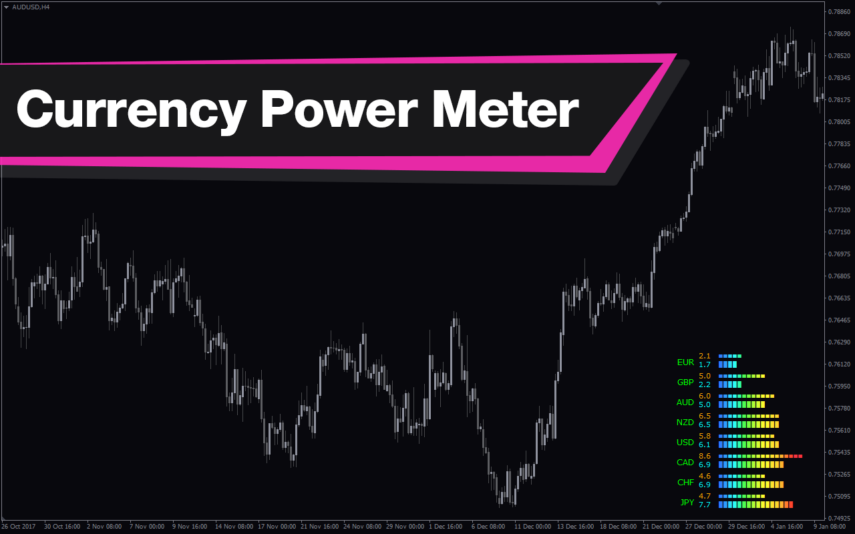
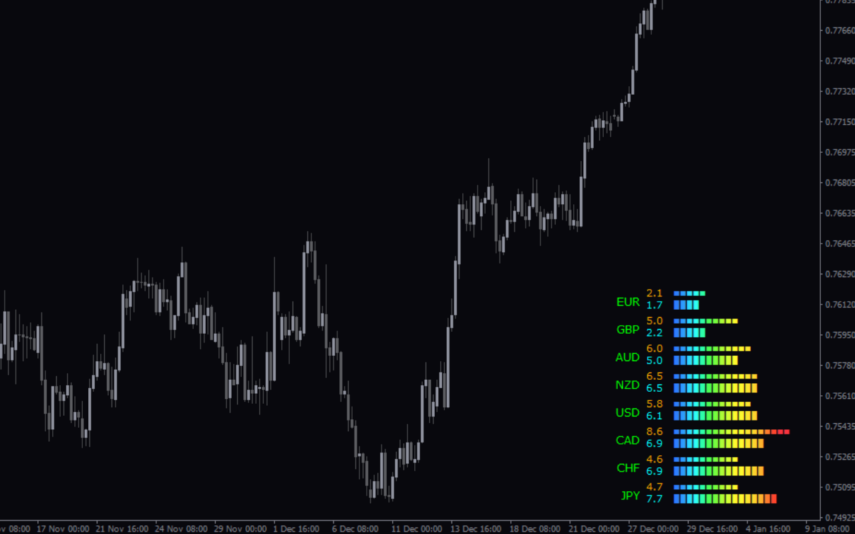
Currency Meter
The Currency Meter Indicator is a popular and free Forex indicator for MT4 that is useful for traders of all levels. This indicator helps traders to identify the strength and weakness of the currencies they are trading. It also provides an overview of the market trend, the current volatility, and the relative strength of the currencies. The Currency Meter Indicator is highly customizable and can be used to identify the best entry and exit points. With this indicator, traders can easily identify the best opportunities in the Forex market and make profitable trades.
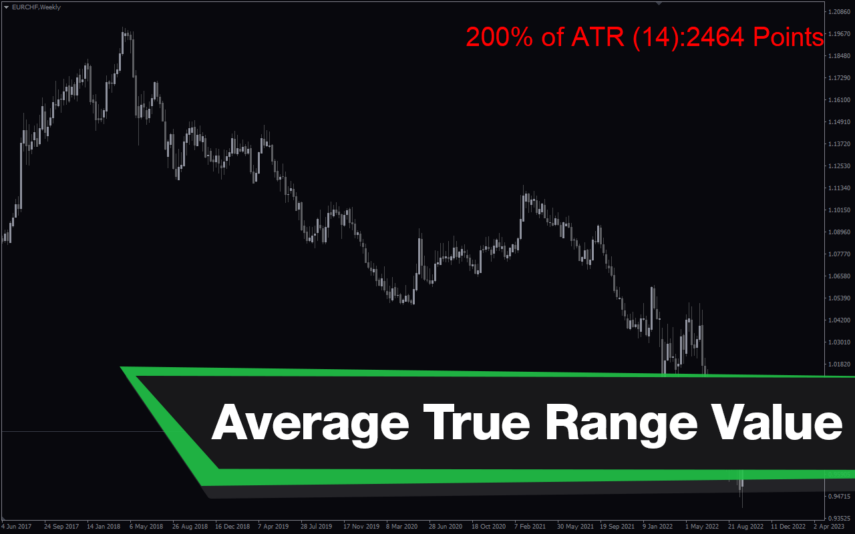
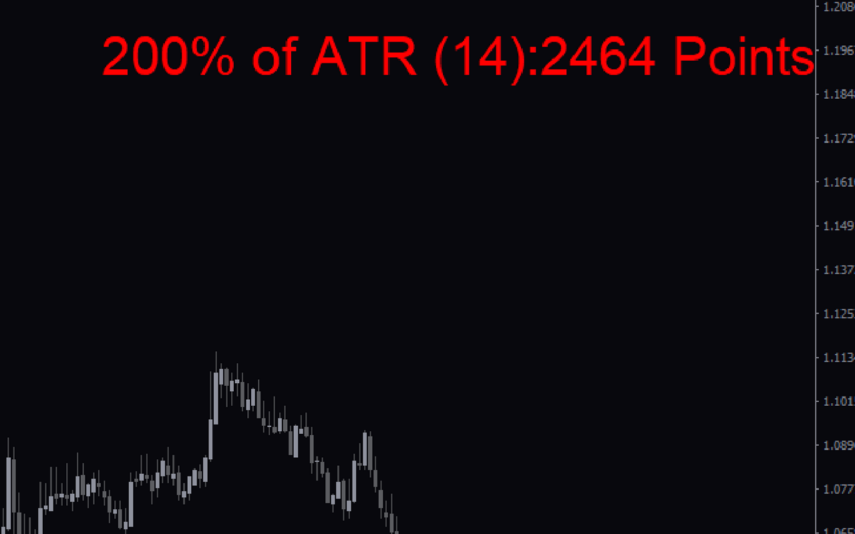
Average True Range
The Average True Range Value indicator is a popular and free forex indicator available on MT4. This new indicator calculates the Average True Range (ATR) for the specified period and displays it in the corner of the chart. The ATR is a useful indicator for measuring market volatility and identifying potential trading opportunities that you can use to set stop loss levels or determine entry and exit points for your trades. Use the Average True Range Indicator to update your personal trading toolbox.
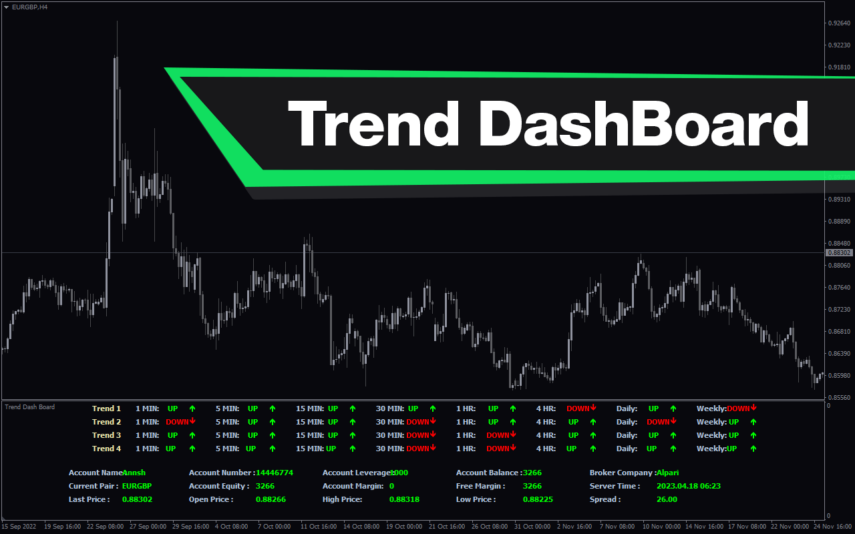
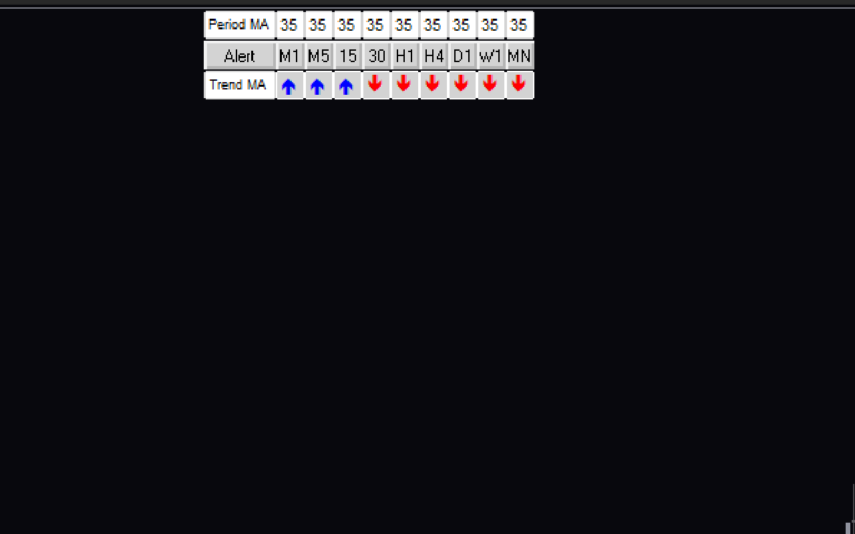
Trend DashBoard
The Trend Dashboard Indicator is a powerful MT4 tool for forex traders who want to keep track of multiple currency pairs and timeframes on one chart. The indicator uses a dashboard to display the trend direction and strength for different currency pairs and timeframes. It also includes an alert feature that can notify traders of potential trading opportunities. With this indicator, traders can save time and stay on top of market trends, allowing them to make informed trading decisions.

Risk Management
The Risk Management Indicator is a popular and free MT4 Forex indicator that is useful for traders looking to manage their risk. This indicator helps traders to identify and set stop loss and take profit levels for their trades. The indicator works by monitoring the market and alerting traders when the stop loss or take profit levels are reached. The Risk Management Indicator is a popular and free MT4 Forex indicator that is easy to use and can help traders to manage their risk and protect their capital.
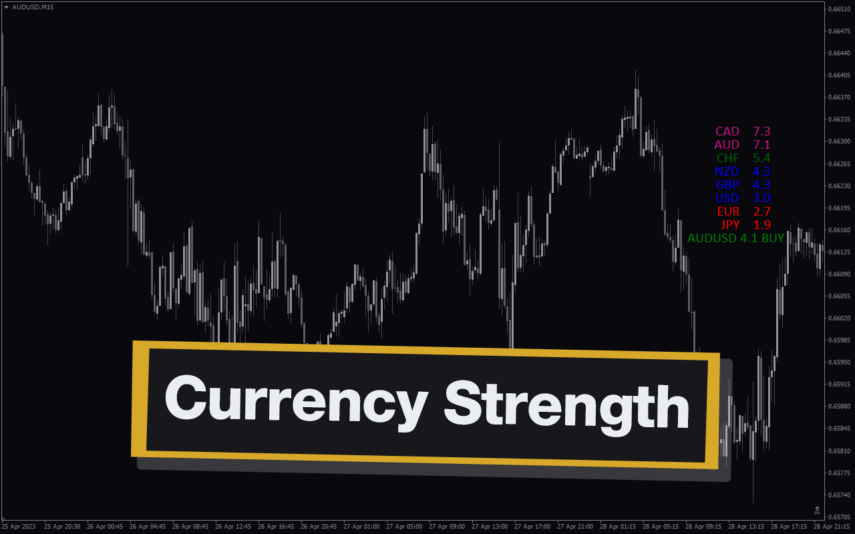
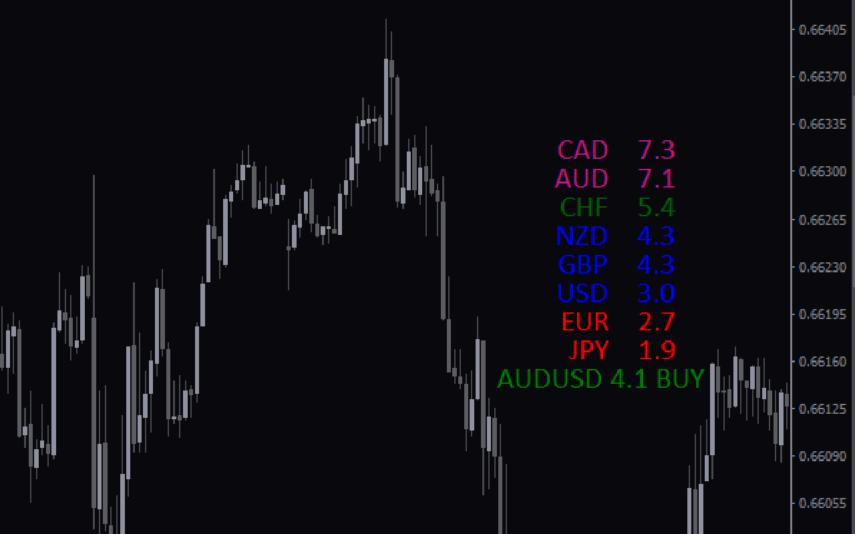
Currency Strength Giraia 28 Pairs TRO Modified
The Currency Strength Giraia 28 Pairs TRO Modified Indicator is a popular and free forex indicator for the MT4 trading platform. The indicator works by analyzing the 28 most traded currency pairs and displaying the results in an easy to read graphical format. The indicator also provides alerts when certain currency pairs reach certain levels of strength. The indicator is easy to install and use, making it a popular choice among forex traders.
Reviews
There are no reviews yet.