• MT4 Collections
    • Top Indicators Hot
      • Top Rated
      • Top Downloads
      • Most Popular
      • New
      • Recommended
    • Trading Style
      • Beginner For Newbies
      • Scalping
      • Short-Term
      • Day Trading
      • Intraday
      • Swing
    • Indicator Type
      • Accurate
      • Leading
      • Reversal
      • Breakout
      • Sideways
      • Entry & Exit
      • Overbought & Oversold
      • Non-Repaint
    • Categories
      • Trend
      • Signal
      • Support & Resistance
      • Price Action
      • Stochastic
      • Envelope
      • Volume
      • Helpers
    • Timeframes
      • M1-M5
      • M15-M30
      • H1-H4
      • D1-W1
      • Multi Timeframe
    • Platform
      • MT4 Popular
      • MT5
  • Indicators
  • Blog
  • CONTACT US
  • ABOUT US
Menu
Search
Select category
  • Select category
  • Envelope Indicators
  • Helpers
  • Price Action
  • Signal
  • Stochastic
  • Support & Resistance
  • Trend
  • Volume
0 Wishlist
Home Collection Stochastic RSI Divergence
Buy Sell Indicator
Back to products
Keltner Channel
MT5
Watch video
Click to enlarge

RSI Divergence

RSI Divergence Indicator: Spot market momentum shifts with this tool. Detect divergences between price action and RSI, predicting reversals. Customizable settings for precise analysis. Bullish and bearish signals are highlighted for confident trading decisions.

Trading Style

Intraday

,

Short-term

Indicator Type

Overbought & Oversold

Timeframe

H1-H4

,

M15-M30

Platform

MT5

Add to wishlist
0 People watching this product now!
Category: Stochastic
Share:

Downloads - 256

Download now
  • Description
  • Reviews (0)
  • How to Install
Description

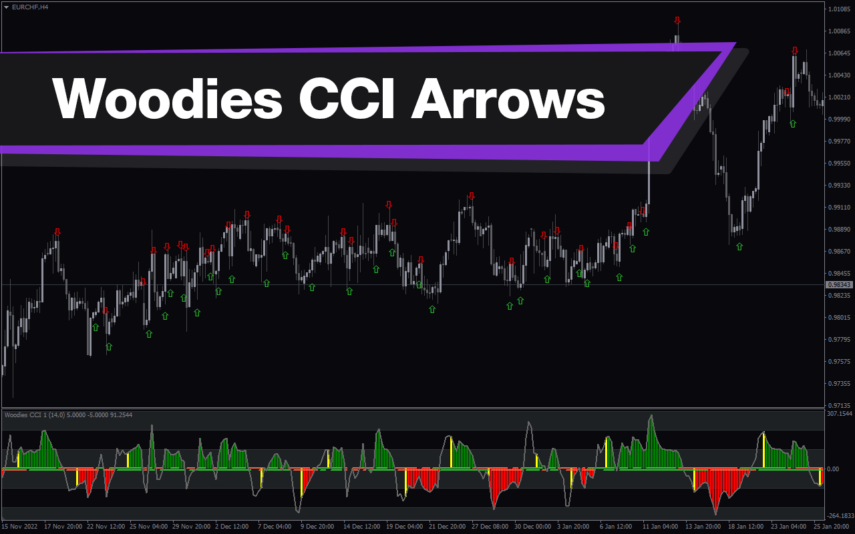
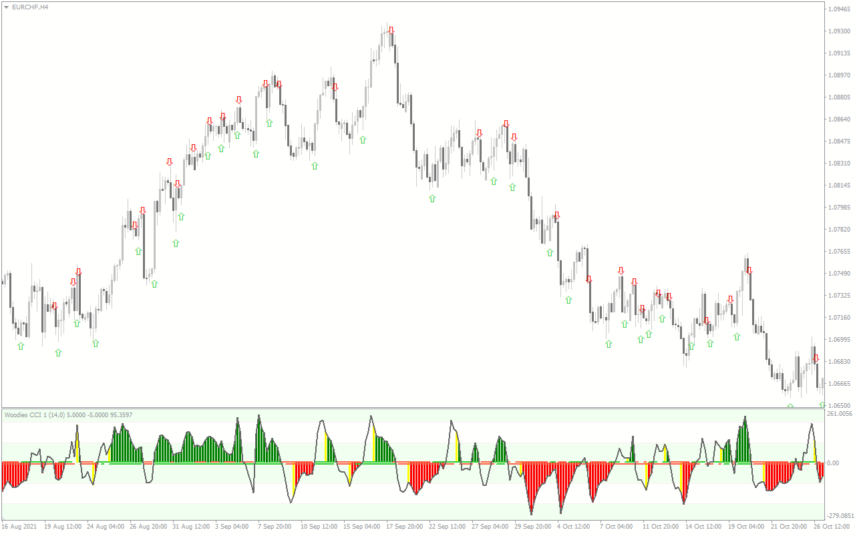
Features of the RSI Divergence Indicator

An RSI divergence indicator alerts traders when price action and the RSI indicator no longer reflect the same momentum. Relative Strength Index, or RSI, is a momentum indicator that assesses price movement to determine if the market is overbought or oversold.

It’s in a range of 0 to 100. A decline below 30 on the Relative Strength Index indicates an oversold state in the market. A reading of 70 or higher on the Index suggests that the market is overbought. The main problem with using an indicator is that there aren’t enough signals. It is rare for this indicator to approach the overbought and oversold positions.

You require divergence from the conventional indicator to overcome this issue. When a market pulls back, divergence can help you predict when it will likely restart its trend. It can only help predict reversals.

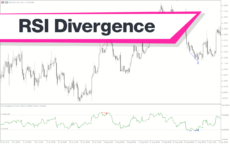
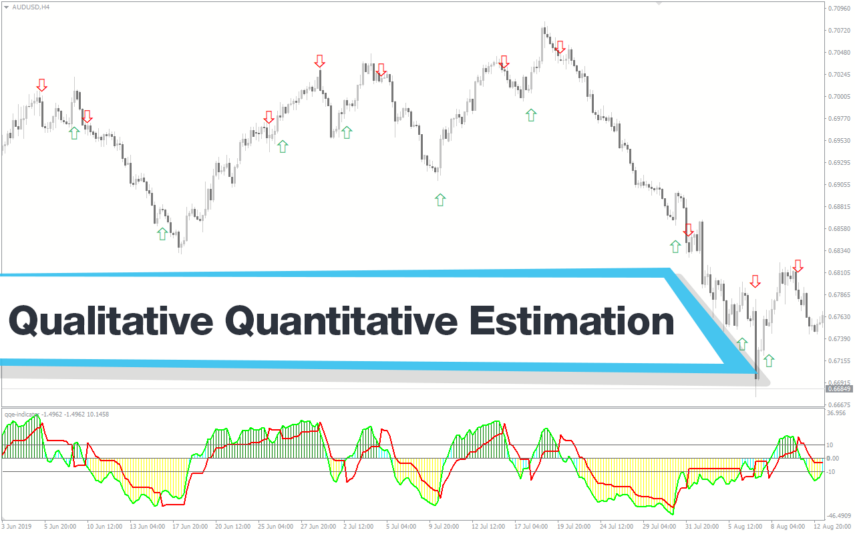
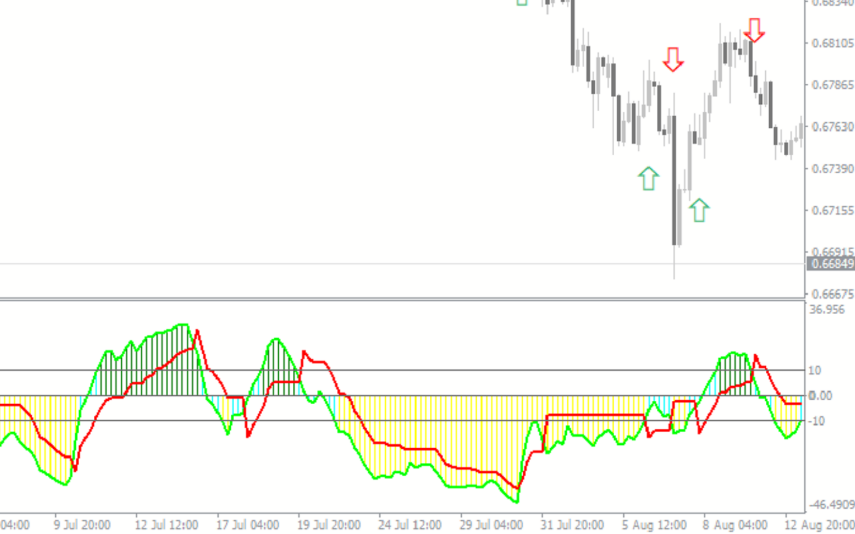
This indicator appears in a separate window at the bottom of the chart. It appears in the form of a green line graph. The indicator draws a blue line and arrow to represent a bullish divergence and a red line and arrow to represent a bearish divergence.

How the Indicator Can Benefit You

When the RSI indicator is oversold, a bullish divergence appears, followed by a higher low that lines up with lower lows in the price movement. This represents a buy signal anticipating a trend reversal to the bullish side. A bearish divergence occurs when the relative strength index indicator is overbought, followed by a lower high corresponding to higher highs in the price movement. This represents a sell signal anticipating a trend reversal to the bearish side.

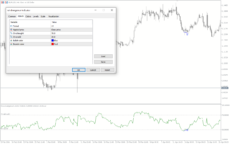
Indicator Setting Description

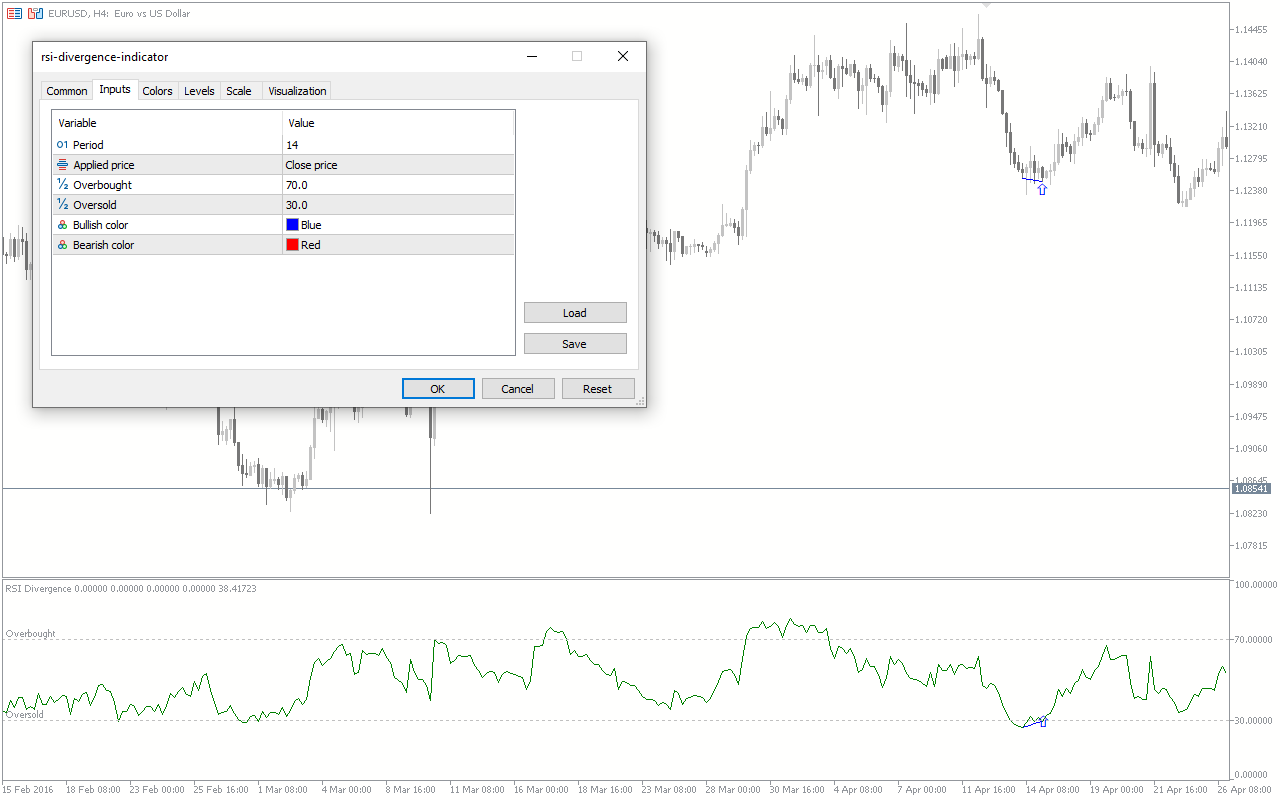
Period: Allows you to change the period the indicator uses to calculate.

Applied price: Allows you to change the price the indicator uses to calculate (Open, Close, High, Low, etc.).

Overbought: Allows you to change the overbought level of the indicator.

Oversold: Allows you to change the oversold level of the indicator.

Bullish color: Allows you to change the color for the bullish movements of the price

Bearish color: Allows you to change color for the bearish movements of the price

Reviews (0)

Reviews

There are no reviews yet.

Be the first to review “RSI Divergence” Cancel reply

Your email address will not be published. Required fields are marked *

1 2 3 4 5
1 2 3 4 5
1 2 3 4 5

How to Install

How install MT4/5 indicator in the terminal?

To install an MT4/5 indicator in the terminal, follow these steps:

  1. Download the indicator file (.ex4 or .mq4/.ex5 or .mq5) to your computer.

  2. Open the MT4/5 terminal and click on “File” in the top left corner.

  3. Select “Open Data Folder” from the dropdown menu.

  4. In the window that opens, double-click on the “MQL4/5” folder.

  5. Double-click on the “Indicators” folder.

  6. Drag and drop the indicator file from your computer into the “Indicators” folder.

  7. Close the data folder window and restart the MT4/5 terminal.

  8. The indicator should now be available in the “Navigator” window on the left-hand side of the terminal. Simply double-click on the indicator to add it to a chart.

Note: If the indicator is in a .zip file, you will need to extract it first before following the above steps.

And if asks to confirm DLL?

If the indicator you are installing requires access to external Dynamic Link Libraries (DLLs), you may see a pop-up message asking you to confirm the use of DLLs.

DLLs are external libraries that contain code that can be used by other programs. In the case of MT4/5 indicators, they are often used to perform complex calculations or connect to external data sources.

If you trust the source of the indicator and want to use it, click “Yes” to confirm the use of DLLs. If you are not sure or do not trust the source, click “No” to cancel the installation.

It’s worth noting that some indicators may not work properly without access to their required DLLs. If you choose not to allow access to DLLs and the indicator does not work as expected, you may need to reinstall the indicator and confirm the use of DLLs to get it to work properly.


Related products

MT4
Quick view
Add to wishlist

Rsi 3Tf Alert

Signal, Stochastic
Get three time frames RSI crossover trading signals with RSI 3TF Alert indicator. Provides a different approach to combine RSI for forex buy and sell arrow trading signals with alerts. With Built-in filter for high probability trading signals. Free to download and easy to install.
MT4
Quick view
Add to wishlist

Schaff Trend Cycle

Signal, Stochastic
The Schaff Trend Cycle indicator is a popular forex indicator for MT4, which determines market trends with high accuracy. Its values range from 0 to 100, with values above 75 indicating overbought and values below 25 indicating oversold. Whether you are a beginner or an experienced trader, the Schaff Trend Cycle indicator will help you make better trading decisions and improve profitability.
MT4
Quick view
Add to wishlist

MACD Divergence

Stochastic
The MACD Divergence Indicator is a powerful tool that helps traders identify trend reversal points in the market. It is a popular and free indicator that is compatible with the MT4 platform. This new indicator plots divergences between the MACD indicator and the price on your chart, making it easy to spot potential trend reversals. It works by measuring the difference between two moving averages, and traders can use it to identify bullish or bearish divergences. With its ability to identify trend reversal points, this indicator is useful for both beginner and advanced traders.
MT4
Quick view
Add to wishlist

Qualitative Quantitative Estimation

Signal, Stochastic
The Qualitative Quantitative Estimation Indicator is a powerful tool for traders in the Forex market. It's a new and popular indicator that works with the MT4 platform. The QQE Indicator is used to determine market trends, identify overbought and oversold positions, and detect divergence in prices and momentum.
MT4
Quick view
Add to wishlist

Renko Charts

Stochastic
The Renko Charts indicator is a popular free MT4 tool used by forex traders to analyze market trends. It works by plotting price movements as "bricks" on a chart, where each brick represents a predetermined price range. This helps filter out market noise and highlight the direction of the trend. Make The Renko Charts indicator a useful tool to improve your Forex trading strategies.
MT4
Quick view
Add to wishlist

Woodies CCI Arrows Oscillator

Signal, Stochastic
The Woodies CCI Arrows Oscillator Indicator is a popular MT4 technical analysis tool used by forex traders to identify trends and potential entry and exit points wich based on the Woodies CCI system, which helps traders to identify when a trend is strong and when it may be weakening. The arrows on the indicator show when the price is moving in a particular direction, and the oscillator provides additional confirmation of the trend's strength. The Woodies CCI Arrows Oscillator Indicator is a valuable addition to any trader's toolkit, and it can help traders make better-informed trading decisions.
MT4
Quick view
Add to wishlist

ROC Indicator

Signal, Stochastic
The ROC Indicator is a popular and useful Forex indicator for MT4 that is free to download. It is used to measure the rate of change in price movements over a given time period. The indicator is useful for traders as it can help identify when a price is overbought or oversold, and when a trend is reversing. The ROC Indicator is a popular and useful tool for traders who want to make informed decisions about their trading strategies.
MT4
Quick view
Add to wishlist

TMA MACD

Signal, Stochastic
The TMA MACD indicator displays buy and sell entries when the MACD and the TMA line cross.
    Close
    Indicator Categories
    • Envelope Indicators 303
    • Helpers 405
    • Price Action 165
    • Signal 1110
    • Stochastic 1675
    • Support & Resistance 558
    • Trend 890
    • Volume 145
    • MT4 COLLECTION HOT
      • Top Rated
      • Top Downloads
      • Most Popular
      • New
      • Recommended
    • Trading Style
      • Beginner For Newbies
      • Scalping
      • Short-Term
      • Day Trading
      • Intraday
      • Swing
    • INDICATOR TYPE
      • Accurate
      • Leading
      • Reversal
      • Breakout
      • Sideways
      • Entry & Exit
      • Overbought & Oversold
      • Non-Repaint
    • CATEGORIES
      • Trend
      • Signal
      • Support & Resistance
      • Price Action
      • Stochastic
      • Envelope
      • Volume
      • Helpers
    • Timeframe
      • M1-M5
      • M15-M30
      • H1-H4
      • D1-W1
      • Multi Timeframe
    • Platform
      • MT4 Popular
      • MT5
    • USEFUL LINKs
      • Privacy Policy
      • Cookie Policy
      • Terms of Use
      • Disclaimer
      • About Us
      • Contact Us
    Logo-grayscale-transparent-720
    Unlock your trading potential with our powerful indicator library.

    Follow us:

    MT4COLLECTION.COM © 2024 All Rights Reserved.
    • Menu
    • Categories
    • Signal
    • MT4 Collections
    • Collection
    • Blog
    • About us
    • Contact us
    • Wishlist
    Get Sentiment Indicators with 70% OFF. Only on Black Friday! View Offer Only till DEC, 2
    Sidebar
    We use cookies to improve your experience on our website. By browsing this website, you agree to our use of cookies.
    Accept