• MT4 Collections
    • Top Indicators Hot
      • Top Rated
      • Top Downloads
      • Most Popular
      • New
      • Recommended
    • Trading Style
      • Beginner For Newbies
      • Scalping
      • Short-Term
      • Day Trading
      • Intraday
      • Swing
    • Indicator Type
      • Accurate
      • Leading
      • Reversal
      • Breakout
      • Sideways
      • Entry & Exit
      • Overbought & Oversold
      • Non-Repaint
    • Categories
      • Trend
      • Signal
      • Support & Resistance
      • Price Action
      • Stochastic
      • Envelope
      • Volume
      • Helpers
    • Timeframes
      • M1-M5
      • M15-M30
      • H1-H4
      • D1-W1
      • Multi Timeframe
    • Platform
      • MT4 Popular
      • MT5
  • Indicators
  • Blog
  • CONTACT US
  • ABOUT US
Menu
Search
Select category
  • Select category
  • Envelope Indicators
  • Helpers
  • Price Action
  • Signal
  • Stochastic
  • Support & Resistance
  • Trend
  • Volume
0 Wishlist
Home Collection Signal Precision Trend Histogram
DSL DMI Oscillator
Back to products
I Regr Indicator
MT5
Watch video
Click to enlarge

Precision Trend Histogram

Easily spot trends with the Precision Trend Histogram. Buy when the indicator shows lime green bars and sell when it shows orange bars.

Trading Style

Beginner

Indicator Type

Overbought & Oversold

Timeframe

D1-W1

,

H1-H4

,

M15-M30

Platform

MT5

Add to wishlist
0 People watching this product now!
Category: Signal
Share:

Downloads - 77

Download now
  • Description
  • Reviews (0)
  • How to Install
Description

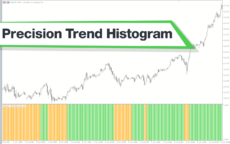
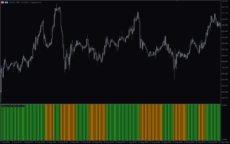
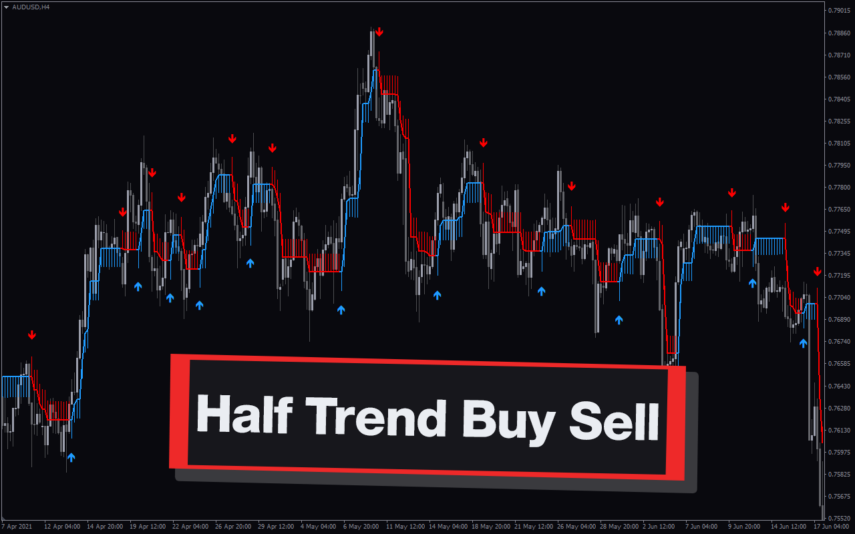
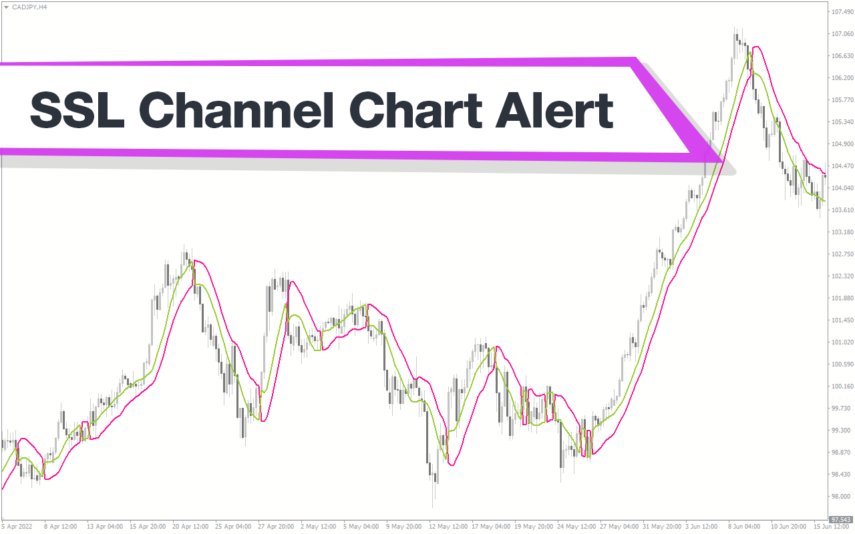
Features of the Precision Trend Histogram Indicator

The Precision Trend Histogram for MT5 draws a histogram on the current timeframe that helps traders identify the prevailing trend. The histogram has lime green and orange bars, which are quite easy to read. The lime green bars indicate a bullish trend, while the orange bars indicate a bearish trend. You can change the colors depending on your preference.

How the Indicator Can Benefit You

Every good trade starts with knowing the general direction of the price. This is where the Precision Trend Histogram indicator comes in. It allows traders to trade with the trend.

When the histogram bars turn lime green, it shows an uptrend, which is the best time to buy. Here, you can wait for pullbacks to join the trend. Meanwhile, when the bars turn orange, it indicates a downtrend and time to sell. Here, traders can wait for pullbacks to join the trend.

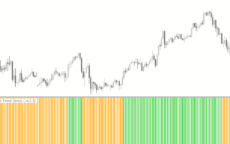
Additionally, the indicator allows you to spot looming reversals. The histogram bars are mostly green in a bullish market. However, when orange bars increase in number, it is a sign that the uptrend might be exhausted. Therefore, exit your long position and wait to trade in the opposite direction.

On the other hand, the histogram bars are mostly orange when the price is on a downtrend. Therefore, it is a good time to exit when there are more lime green bars. You can use it with other tools like trendlines and moving averages to confirm reversals.

Indicator Settings Description

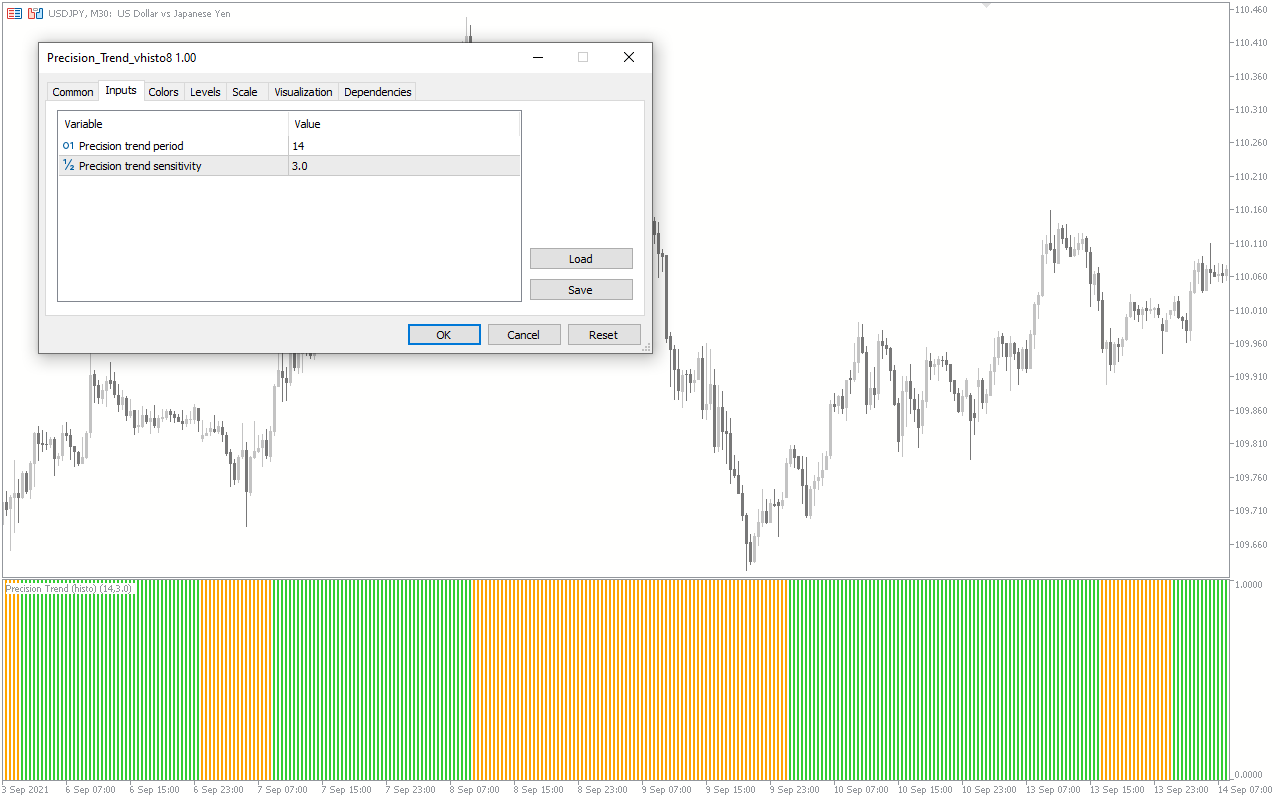
Precision trend period: This allows you to change the indicator’s period.

Precision trend sensitivity: This will enable you to change the sensitivity of the histogram bars.

Reviews (0)

Reviews

There are no reviews yet.

Be the first to review “Precision Trend Histogram” Cancel reply

Your email address will not be published. Required fields are marked *

1 2 3 4 5
1 2 3 4 5
1 2 3 4 5

How to Install

How install MT4/5 indicator in the terminal?

To install an MT4/5 indicator in the terminal, follow these steps:

  1. Download the indicator file (.ex4 or .mq4/.ex5 or .mq5) to your computer.

  2. Open the MT4/5 terminal and click on “File” in the top left corner.

  3. Select “Open Data Folder” from the dropdown menu.

  4. In the window that opens, double-click on the “MQL4/5” folder.

  5. Double-click on the “Indicators” folder.

  6. Drag and drop the indicator file from your computer into the “Indicators” folder.

  7. Close the data folder window and restart the MT4/5 terminal.

  8. The indicator should now be available in the “Navigator” window on the left-hand side of the terminal. Simply double-click on the indicator to add it to a chart.

Note: If the indicator is in a .zip file, you will need to extract it first before following the above steps.

And if asks to confirm DLL?

If the indicator you are installing requires access to external Dynamic Link Libraries (DLLs), you may see a pop-up message asking you to confirm the use of DLLs.

DLLs are external libraries that contain code that can be used by other programs. In the case of MT4/5 indicators, they are often used to perform complex calculations or connect to external data sources.

If you trust the source of the indicator and want to use it, click “Yes” to confirm the use of DLLs. If you are not sure or do not trust the source, click “No” to cancel the installation.

It’s worth noting that some indicators may not work properly without access to their required DLLs. If you choose not to allow access to DLLs and the indicator does not work as expected, you may need to reinstall the indicator and confirm the use of DLLs to get it to work properly.


Related products

MT4
Quick view
Add to wishlist

Schaff Trend Cycle

Signal, Stochastic
The Schaff Trend Cycle indicator is a popular forex indicator for MT4, which determines market trends with high accuracy. Its values range from 0 to 100, with values above 75 indicating overbought and values below 25 indicating oversold. Whether you are a beginner or an experienced trader, the Schaff Trend Cycle indicator will help you make better trading decisions and improve profitability.
MT4
Quick view
Add to wishlist

Half Trend Buy Sell

Signal
Half Trend Buy Sell MT4 Indicator - Precise trend signals with non-repainting arrows for forex trading. Optimal entries and exits. Amplitude, arrow, and alert settings are available.
MT4
Quick view
Add to wishlist

Keltner Channel With Signals

Signal, Envelope Indicators
The Keltner Channel with Signals Indicator is a popular and free forex indicator that runs on the MT4 platform. This is a new and innovative tool that uses the Keltner Channel as the basis for generating trading signals, helping traders identify potential trading opportunities. Use the Keltner Channel with Signals Indicator as a powerful tool that can help traders succeed in the forex market.
MT4
Quick view
Add to wishlist

RSI Divergence

Signal
Enhance trading precision with the RSI Divergence indicator. Overcome signal challenges by leveraging divergence signals, which is vital for identifying potential market reversals. Customize settings, draw trendlines, and receive alerts for good trading decisions. Explore the power of the RSI Divergence indicator in assessing market conditions.
HotMT4
Quick view
Add to wishlist

Super Arrow

Signal
The Super Arrow Indicator is a forex tool for MT4 that generates high-probability trading signals by using multiple indicators such as Moving Averages, Relative Strength Index, Bollinger Bands, and Magic Filter. It filters out false signals and provides good trade signals by combining these indicators.
MT4
Quick view
Add to wishlist

Qualitative Quantitative Estimation

Signal, Stochastic
The Qualitative Quantitative Estimation Indicator is a powerful tool for traders in the Forex market. It's a new and popular indicator that works with the MT4 platform. The QQE Indicator is used to determine market trends, identify overbought and oversold positions, and detect divergence in prices and momentum.
MT4
Quick view
Add to wishlist

SSL Channel Chart Alert

Signal, Trend
Better your forex trading with the SSL Channel Chart Alert Indicator. Seamlessly combining Moving Averages, it offers clear buy and sell signals for trend traders. Benefit from non-repainting signals and easy-to-use settings.
MT4
Quick view
Add to wishlist

PZ ABCD Retracement

Signal, Price Action
The PZ ABCD Retracement Indicator is a popular and free forex indicator for MT4 that helps traders identify potential trading opportunities by identifying the AB=CD harmonic pattern. The indicator automatically plots Fibonacci retracement levels to help traders identify entry and exit points. It works by scanning the market for the AB=CD pattern and drawing the necessary lines and levels. It can be used by both a novice and an experienced trader, making it a versatile tool for traders who want to improve their trading results.
    Close
    Indicator Categories
    • Envelope Indicators 303
    • Helpers 405
    • Price Action 165
    • Signal 1110
    • Stochastic 1675
    • Support & Resistance 558
    • Trend 890
    • Volume 145
    • MT4 COLLECTION HOT
      • Top Rated
      • Top Downloads
      • Most Popular
      • New
      • Recommended
    • Trading Style
      • Beginner For Newbies
      • Scalping
      • Short-Term
      • Day Trading
      • Intraday
      • Swing
    • INDICATOR TYPE
      • Accurate
      • Leading
      • Reversal
      • Breakout
      • Sideways
      • Entry & Exit
      • Overbought & Oversold
      • Non-Repaint
    • CATEGORIES
      • Trend
      • Signal
      • Support & Resistance
      • Price Action
      • Stochastic
      • Envelope
      • Volume
      • Helpers
    • Timeframe
      • M1-M5
      • M15-M30
      • H1-H4
      • D1-W1
      • Multi Timeframe
    • Platform
      • MT4 Popular
      • MT5
    • USEFUL LINKs
      • Privacy Policy
      • Cookie Policy
      • Terms of Use
      • Disclaimer
      • About Us
      • Contact Us
    Logo-grayscale-transparent-720
    Unlock your trading potential with our powerful indicator library.

    Follow us:

    MT4COLLECTION.COM © 2024 All Rights Reserved.
    • Menu
    • Categories
    • Signal
    • MT4 Collections
    • Collection
    • Blog
    • About us
    • Contact us
    • Wishlist
    Get Sentiment Indicators with 70% OFF. Only on Black Friday! View Offer Only till DEC, 2
    Sidebar
    We use cookies to improve your experience on our website. By browsing this website, you agree to our use of cookies.
    Accept