• MT4 Collections
    • Top Indicators Hot
      • Top Rated
      • Top Downloads
      • Most Popular
      • New
      • Recommended
    • Trading Style
      • Beginner For Newbies
      • Scalping
      • Short-Term
      • Day Trading
      • Intraday
      • Swing
    • Indicator Type
      • Accurate
      • Leading
      • Reversal
      • Breakout
      • Sideways
      • Entry & Exit
      • Overbought & Oversold
      • Non-Repaint
    • Categories
      • Trend
      • Signal
      • Support & Resistance
      • Price Action
      • Stochastic
      • Envelope
      • Volume
      • Helpers
    • Timeframes
      • M1-M5
      • M15-M30
      • H1-H4
      • D1-W1
      • Multi Timeframe
    • Platform
      • MT4 Popular
      • MT5
  • Indicators
  • Blog
  • CONTACT US
  • ABOUT US
Menu
Search
Select category
  • Select category
  • Envelope Indicators
  • Helpers
  • Price Action
  • Signal
  • Stochastic
  • Support & Resistance
  • Trend
  • Volume
0 Wishlist
Home Collection Trend Linear Regression Slope
Macd With Ema
Back to products
Profit Line
MT4
Watch video
Click to enlarge

Linear Regression Slope

Read market momentum and get buy and sell signals with the Linear Regression Slope indicator. It helps you catch strong trends that can result in bigger profits.

Trading Style

Intraday

,

Short-term

Indicator Type

Reversal

Timeframe

D1-W1

,

H1-H4

,

M15-M30

Platform

MT4

Add to wishlist
0 People watching this product now!
Categories: Stochastic, Trend
Share:

Downloads - 55

Download now
  • Description
  • Reviews (0)
  • How to Install
Description

Features of the Linear Regression Slope Indicator

The Linear Regression Slope indicator allows traders to read the strength of the current move. It shows momentum, which is important for finding the best trading opportunities. The indicator is simple to use and easy to read, allowing all types of traders to use it.

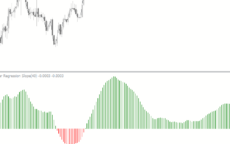
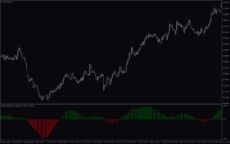
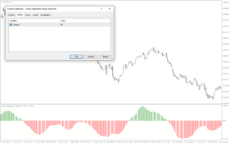
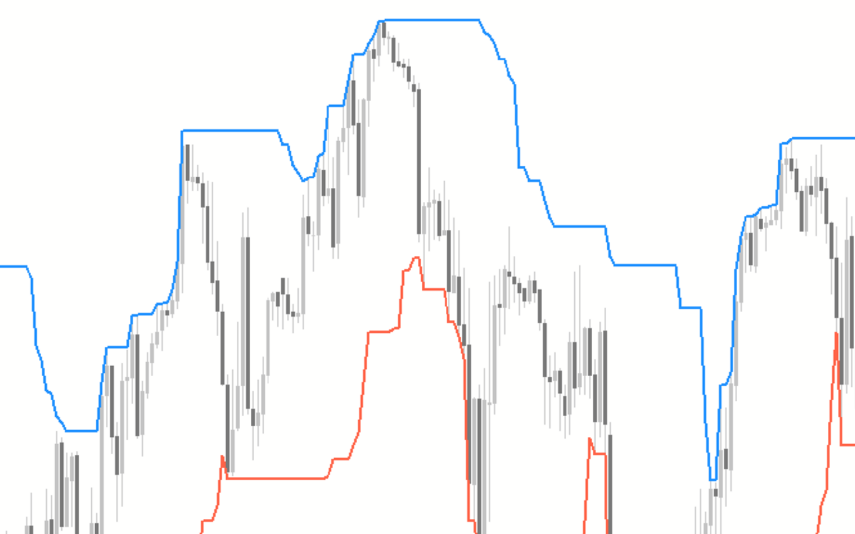
It draws histogram bars at the bottom of the screen with some above the zero line and some below. Those above are green and show a bullish market, while the red ones show a bearish market. When the bars are short, it shows the trend is weak as momentum is low. On the other hand, when the bars are long, it signals a strong trend with solid momentum.

How the Indicator Can Benefit You

The Linear Regression Slope indicator gives great buy and sell signals. When the bars cross above the zero line and turn green, it is a good time to buy. Hold your position until the bars either shorten to show dwindling momentum or cross below the zero line.

For a sell position, wait for the histogram bars to cross below the zero line and turn red. This is a sign that the trend is bearish. Hold the position as long as the bars are below zero and exit when they cross back above.

However, there can be a lot of false signals when you use this indicator alone. Therefore it should be used with other tools that identify the trend. This way, you can filter out short pullbacks. In this case, you only trade in the direction of the trend. When the trend is up and the bars turn red, wait for them to turn green for a buy entry. When the trend is down and the bars turn green, wait for them to turn red and sell.

Indicator Setting Description

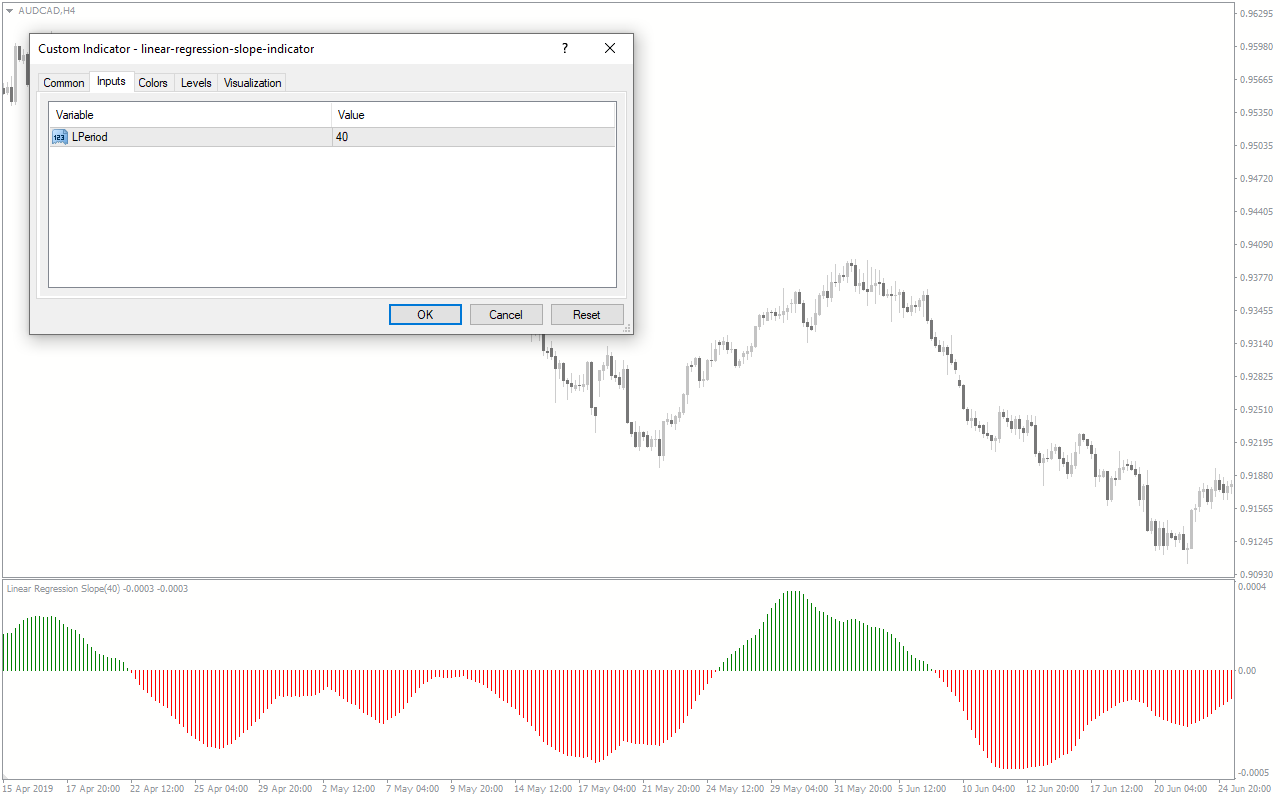
L-Period: This input allows you to change the number of bars the indicator uses to calculate the low of previous trading sessions.

Reviews (0)

Reviews

There are no reviews yet.

Be the first to review “Linear Regression Slope” Cancel reply

Your email address will not be published. Required fields are marked *

1 2 3 4 5
1 2 3 4 5
1 2 3 4 5

How to Install

How install MT4/5 indicator in the terminal?

To install an MT4/5 indicator in the terminal, follow these steps:

  1. Download the indicator file (.ex4 or .mq4/.ex5 or .mq5) to your computer.

  2. Open the MT4/5 terminal and click on “File” in the top left corner.

  3. Select “Open Data Folder” from the dropdown menu.

  4. In the window that opens, double-click on the “MQL4/5” folder.

  5. Double-click on the “Indicators” folder.

  6. Drag and drop the indicator file from your computer into the “Indicators” folder.

  7. Close the data folder window and restart the MT4/5 terminal.

  8. The indicator should now be available in the “Navigator” window on the left-hand side of the terminal. Simply double-click on the indicator to add it to a chart.

Note: If the indicator is in a .zip file, you will need to extract it first before following the above steps.

And if asks to confirm DLL?

If the indicator you are installing requires access to external Dynamic Link Libraries (DLLs), you may see a pop-up message asking you to confirm the use of DLLs.

DLLs are external libraries that contain code that can be used by other programs. In the case of MT4/5 indicators, they are often used to perform complex calculations or connect to external data sources.

If you trust the source of the indicator and want to use it, click “Yes” to confirm the use of DLLs. If you are not sure or do not trust the source, click “No” to cancel the installation.

It’s worth noting that some indicators may not work properly without access to their required DLLs. If you choose not to allow access to DLLs and the indicator does not work as expected, you may need to reinstall the indicator and confirm the use of DLLs to get it to work properly.


Related products

MT4
Quick view
Add to wishlist

Donchian Channel

Trend, Envelope Indicators
The Donchian Channel Indicator is a popular forex indicator that is widely used by forex traders to determine trend direction as well as entry and exit points designed to be used in the forex market with the MT4 platform. This indicator is very popular among traders because of its simplicity and efficiency, it works by determining the high and low of the price for a certain period and plotting a channel based on these values. The Donchian Channel Indicator is a popular and effective forex indicator that gives clear market entry and exit signals, making it an essential tool in a successful forex trader's toolbox.
MT4
Quick view
Add to wishlist

Auto Trend Channel

Trend, Support & Resistance
AutoTrendChannel Indicator for MT4 - Easy trend analysis and trading with automatic channel plotting. Enhance your trading strategy now.
MT4
Quick view
Add to wishlist

VWAP Bands

Trend, Volume
Discover the power of the VWAP Bands indicator, which emphasizes volume in its calculation. Gain insights into support and resistance levels, fair value, and trading opportunities. Suitable for all traders, this versatile Metatrader Indicator allows customization across various time frames with adjustable settings for better trading.
MT4
Quick view
Add to wishlist

Exponential Moving Average

Trend
The EMA Indicator is a popular new forex tool for MT4 that is available for free download. It is a type of moving average that provides more weight to recent price changes, making it more responsive to current market conditions. The EMA indicator works by calculating the average price of an asset over a given period, with more emphasis placed on recent price action. This makes it a useful tool for traders looking to identify trends and changes in market direction.
MT4
Quick view
Add to wishlist

Auto Trend Lines Channels

Trend
The Auto-Trend Lines Channels indicator for MT4 displays trend lines and channels on the chart. The Auto Trend Lines and Channels Indicator is easy to use, and it works by analyzing the market price action to identify key support and resistance levels.
MT4
Quick view
Add to wishlist

Automatic Trendlines

Trend
The Automatic Trendlines indicator is a new and popular free to use MT4 indicator designed to automatically draw trendlines on your chart, saving you time and effort. The indicator uses advanced algorithms to determine trendlines based on price movement and can be used on any currency pair or timeframe. The Automatic Trendlines indicator is a useful tool for traders who want to quickly and easily identify trends in their charts.
MT4
Quick view
Add to wishlist

Swing ZZ Zigzag

Signal, Trend
The Swing ZZ Zigzag indicator is an MT4 indicator that connects the peaks and troughs for potential trend reversal signals.
MT4
Quick view
Add to wishlist

Heikin Ashi Candle

Trend
The Heikin Ashi Candle Indicator is a new and popular forex indicator for MT4 that provides traders with a unique way to analyze price movements. It is designed to display candles on a chart in a way that filters out market noise and shows a clearer picture of the trend. The Heikin Ashi Candle indicator averages the open, close, high and low prices of each candle to create a smoother and more readable trend. This indicator is useful for traders of all skill levels as it simplifies the process of spotting trends and potential market reversals.
    Close
    Indicator Categories
    • Envelope Indicators 303
    • Helpers 405
    • Price Action 165
    • Signal 1110
    • Stochastic 1675
    • Support & Resistance 558
    • Trend 890
    • Volume 145
    • MT4 COLLECTION HOT
      • Top Rated
      • Top Downloads
      • Most Popular
      • New
      • Recommended
    • Trading Style
      • Beginner For Newbies
      • Scalping
      • Short-Term
      • Day Trading
      • Intraday
      • Swing
    • INDICATOR TYPE
      • Accurate
      • Leading
      • Reversal
      • Breakout
      • Sideways
      • Entry & Exit
      • Overbought & Oversold
      • Non-Repaint
    • CATEGORIES
      • Trend
      • Signal
      • Support & Resistance
      • Price Action
      • Stochastic
      • Envelope
      • Volume
      • Helpers
    • Timeframe
      • M1-M5
      • M15-M30
      • H1-H4
      • D1-W1
      • Multi Timeframe
    • Platform
      • MT4 Popular
      • MT5
    • USEFUL LINKs
      • Privacy Policy
      • Cookie Policy
      • Terms of Use
      • Disclaimer
      • About Us
      • Contact Us
    Logo-grayscale-transparent-720
    Unlock your trading potential with our powerful indicator library.

    Follow us:

    MT4COLLECTION.COM © 2024 All Rights Reserved.
    • Menu
    • Categories
    • Signal
    • MT4 Collections
    • Collection
    • Blog
    • About us
    • Contact us
    • Wishlist
    Get Sentiment Indicators with 70% OFF. Only on Black Friday! View Offer Only till DEC, 2
    Sidebar
    We use cookies to improve your experience on our website. By browsing this website, you agree to our use of cookies.
    Accept